NetSuite Analytics Warehouse: Setup, Architecture & BI
Executive Summary
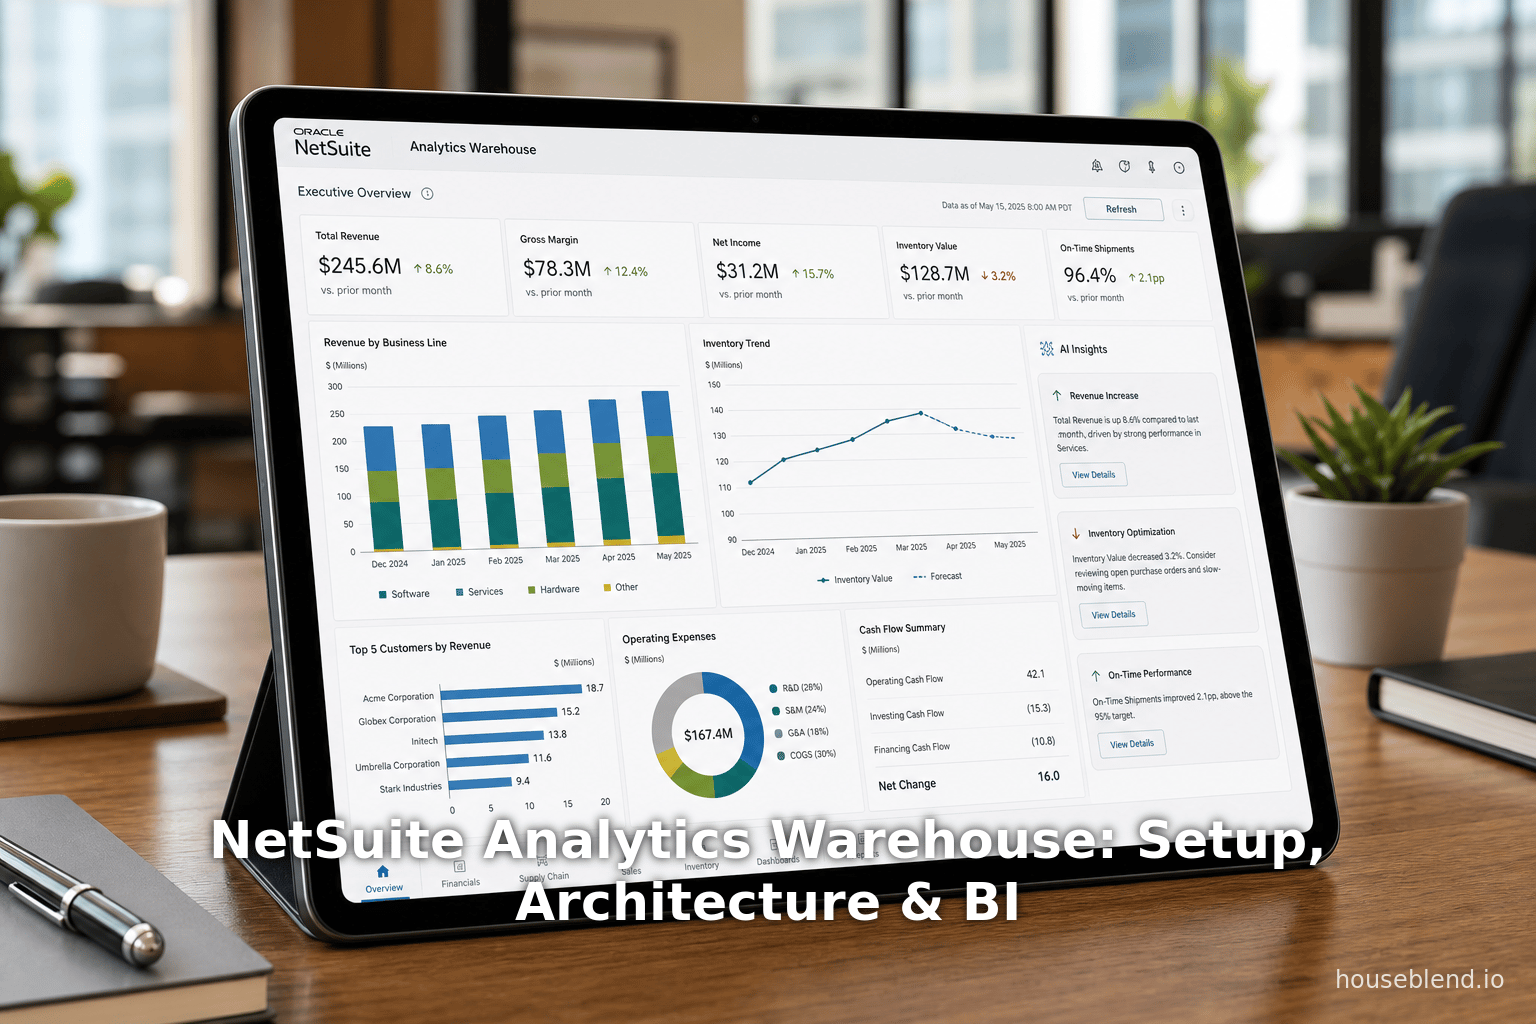
NetSuite Analytics Warehouse (NSAW) is an integrated cloud data warehouse and business intelligence (BI) solution designed specifically for Oracle NetSuite users. Launched at SuiteWorld 2021, NSAW provides a fully managed, AI-equipped data warehouse that consolidates NetSuite ERP data (including custom records and saved searches) and external data sources into a unified analytics environment [1] [2]. Built on Oracle’s Autonomous Data Warehouse (ADW) and front-ended by Oracle Analytics Cloud (OAC), NSAW delivers enterprise-class performance for large-scale analytics workloads [1] [3]. This platform shifts organizations from ad-hoc reporting to scalable, proactive BI. It enables complex cross-system analyses (combining ERP, CRM, eCommerce, and other data) without compromising transactional system performance [4] (Source: annexa.com.au).
NSAW’s key capabilities include pre-built subject-area schemas (e.g. Financials, Inventory, Sales) with ready-to-use metrics and dashboards, automated data pipelines for daily extracts (including historical snapshots), and machine-learning-backed insights. By offloading analytics to the warehouse, companies avoid burdening their live NetSuite instance, unlocking faster query response and larger data volumes than before [4] [5]. In practice, organizations report dramatic improvements. For example, a NetSuite case study found that implementing NSAW at Fellers (a manufacturing distributor) resulted in a 35% increase in process efficiency and a 50% reduction in analysis time, while providing executives with real-time, panoramic dashboards of sales and margin performance [6]. In another example, a financial team cut manual reporting from hours per week to minutes by transitioning a complex backlog report to NSAW [7].
This in-depth report covers the architecture and setup of NSAW, its data modeling framework, typical BI use cases, and real-world case studies. It draws on Oracle’s official documentation, industry analyses, and customer success stories. Extensive citations are provided throughout. The report also discusses NSAW in context: its role relative to SuiteAnalytics (NetSuite’s native analytics), its place in the modern cloud data landscape, and its future direction as Oracle continuously enhances the platform with AI and broader data access.
Introduction and Background
The Need for Integrated Analytics
NetSuite, a cloud-based enterprise resource planning (ERP) and omnichannel commerce platform, has long provided built-in reporting tools ( SuiteAnalytics Workbook, saved searches) for operational insights. However, as NetSuite customer organizations grew, three trends emerged: (1) data volume and complexity exploded across multiple entities and subsidiaries, (2) critical business data remained siloed in disparate systems (e.g. finance, CRM, supply chain, external databases), and (3) executive decision-making demanded real-time, cross-functional insights beyond transactional reports [8] [3]. Traditional SuiteAnalytics and Connect (ODBC access) had limitations in scaling and blending data from multiple sources, often resulting in Excel spaghetti, delays, and bottlenecks因expense of manual data consolidation [9] [2].
In parallel, the broader industry witnessed a shift to cloud data warehousing and AI-driven analytics. Vendors like Snowflake, Amazon Redshift, and Microsoft Azure launched elastic analytics platforms. Oracle itself advanced its Autonomous Data Warehouse (ADW), which automates performance tuning for analytical workloads. For NetSuite, being acquired by Oracle in 2016 meant access to Oracle’s cloud analytics stack. Customers clamored for a purpose-built analytics solution that married NetSuite data with enterprise BI technology. This context led Oracle NetSuite to develop NSAW.
Launch of NSAW
Oracle NetSuite formally introduced the NetSuite Analytics Warehouse at SuiteWorld 2021 [1]. The press release highlighted that “pre-built analytics [in NSAW] help customers accelerate insights and enhance decision making” [1]. This announcement emphasized NSAW’s foundation on Oracle’s cloud services: “Built on Oracle Analytics Cloud and Oracle Autonomous Data Warehouse, NSAW delivers a scalable, high-performance analytics environment” [3]. Unlike previous NetSuite analytics offerings, NSAW was billed as the first integrated, AI-enabled cloud data warehouse for NetSuite. [10]
Since its launch, Oracle has continuously released updates to NSAW. At SuiteWorld 2022 and 2023, Oracle announced enhancements to support larger data volumes, more flexible data refreshes, embedded BI, and extended global availability [11] [12]. By late 2023 NSAW was available in North America, EMEA, APAC, and other key regions [13]. New features include tighter integration with NetSuite dashboards, AI-powered anomaly detection, and industry-specific analytics apps built on NSAW. These ongoing investments signal Oracle’s commitment to evolving NSAW as a core pillar of the NetSuite ecosystem.
Overview of NSAW Architecture
At its core, NSAW is not simply a reporting front-end: it is a separate, dedicated data warehouse. Oracle positions it as “the first and only AI-enabled, prebuilt cloud data warehouse and analytics solution for NetSuite customers” [12].The architecture is built on three layers: a physical layer (Oracle Autonomous Data Warehouse where raw NetSuite data is ingested and stored), a logical layer (business modeling and star schemas), and a presentation layer (semantic interfaces, dashboards, and data mashups) [14]. Figure 1 shows the conceptual flow: NetSuite data (ERP transactions, master records, custom fields) is extracted via automated pipelines into ADW; third-party data sources (CRM, payroll, etc.) can optionally feed into ADW as well; and OAC provides the BI workspace for end users, with model-driven metrics and visualizations [14] [12].

Critically, NSAW is supported by Oracle Autonomous AI Lakehouse technology, meaning it uses columnar storage, in-memory processing, and automated indexing to optimize analytics workloads. Examples include Oracle’s whitepaper noting how ADW “is optimized for analytics workloads” with self-tuning performance [15]. In practice, this means queries on NSAW can scan millions of records and join across domains much faster than on transactional databases. This separation of analytics (NSAW) from transactions (the live NetSuite ERP) ensures that heavy report queries do not slow down day-to-day operations [4].
NSAW Setup and Configuration
Setting up NSAW involves several steps in the NetSuite UI and Oracle Cloud console. This section details the configuration workflow, from enabling the feature to initiating data loads.
Enabling the NSAW Feature
Before any data can flow, the NSAW feature must be enabled in the NetSuite account. According to Oracle’s NetSuite documentation, an administrator should navigate to Setup > Company > Setup Tasks > Enable Features, then select the Analytics subtab and check “NetSuite Analytics Warehouse” [16]. As documented:
“Click the Analytics subtab and check the NetSuite Analytics Warehouse box. Your Analytics Warehouse account starts configuring. This process may take some time.” [17]
Once enabled, Oracle provisions a dedicated NSAW service instance in the cloud. The administrator may see a progress bar or message that the system is being configured. After initial setup (which can take a few minutes or longer), the NSAW configuration page becomes available in NetSuite.
Assigning NSAW Roles and Users
After NSAW is enabled, user roles must be granted access. Typically, an NSAW-specific administrator role is created. Oracle provides documentation on adding users to NSAW [18]. Users with NSAW roles can then access the NSAW dashboards and data. This includes assigning duty roles (predefined security roles for subject areas) and card/deck editor roles (for building visualizations).
NSAW introduces its own admin interfaces in NetSuite under Analytics > SuiteAnalytics > Analytics Warehouse. Administrators use these to control data transfers (see next section), view data model metadata, and manage user privileges. For example, one can use the NetSuite Analytics Warehouse Customization History page as an audit log of all data transfer operations [19].
Setting Up Data Transfers
The heart of NSAW setup is configuring the Data Transfer. NetSuite groups account data into functional areas (also called subject areas) to organize what is loaded into the warehouse [20]. Common functional areas include Financials, Inventory, Sales (Opportunities), Banking, etc. Each functional area corresponds to pre-built data tables in NSAW (e.g., fact tables like Sales Orders, dimension tables like Customer).
To set up data transfer, administrators go to the NSAW configuration page and click “Set Up Data Transfer” [21]. In the Initial Extract Date field, they select a cutoff date to define how far back transactional data should be pulled. Then they select the Subsidiary (if multi-subsidiary) and check which functional areas to include [22]. The UI is shown in Figure 2.

Once configured, NSAW immediately performs an initial load for each chosen area, bringing in historical data up to the extract date. Thereafter, NSAW automatically fetches incremental updates every 24 hours for each enabled functional area [20]. The site notes: “Data from the selected functional areas is refreshed automatically every 24 hours” [20]. Administrators can also manually trigger a transfer at any time using the “Transfer Data” button. The system logs each load in a transfer audit log (viewable on the Customization History page) so admins can monitor success or troubleshoot errors [19].
Implementation Note: The first data transfer can take a significant amount of time, depending on data volume [23]. For large NetSuite tenants with years of data, Oracle recommends scheduling the initial load during off-hours. Subsequent daily syncs are usually much quicker (only recent changes).
Data Extraction Method
Under the hood, NSAW uses a combination of SuiteQL and Oracle integration services. It leverages SuiteAnalytics Connect (the “NetSuite2.com” data source) for reading NetSuite records. Both standard records (e.g. Sales Orders, Invoices) and custom fields/records are eligible for extraction [2]. In practice, NSAW’s data pipelines automatically query NetSuite via SuiteTalk or Connect APIs and push data into ADW tables. The Oracle documentation emphasizes that NSAW extracts all relevant operational data and can incorporate external data sources as well [14] [2].
Customizations may be needed for external data. For instance, Myers-Holum notes that third-party integrations (e.g. Salesforce, Shopify) are possible: “Oracle NetSuite has designated MHI as the go-to partner for adding external NetSuite data sources to NSAW… We are developing and prepackaging a number of third-party integration use cases…” [24]. This means customers can bring CRM or other cloud data into the same warehouse and use joins/aggregations across systems.
Summary of Setup Steps
The NSAW setup yields a streamlined, repeatable process. In summary:
- Enable the NSAW feature in NetSuite (Setup > Company > Enable Features > Analytics) [25].
- Assign NSAW administrator and user roles, ensuring appropriate permissions.
- Configure Data Transfer: Navigate to NSAW Configuration in NetSuite, set Initial Extract Date, pick Subsidiary and functional areas, then initiate the first load [22].
- Monitor transfers via the Audit Log and error reports.
- Schedule regular refresh (default daily) or custom frequency as needed. NSAW will handle incremental loading automatically.
This setup ensures NetSuite data (and optionally external data) flows into the Oracle ADW environment each day, creating a near-real-time analytical store for BI use.
NSAW Data Model and Semantic Layer
The heart of NSAW is its pre-built data model. Oracle provides a factory-defined schema (often a star or snowflake schema) that organizes NetSuite data into subject-area tables, facts, and dimensions. This section details how NSAW models data for analysis and how it exposes that model to business users.
Subject Areas and Schema Design
Oracle organizes NSAW’s data into functional/subject areas that reflect business domains (e.g. Financials, Sales, Inventory). Each subject area consists of one or more fact tables (prefix CF_ or CF_DN) containing measures, and associated dimension tables (D_ or XDR_ prefixes) containing descriptive attributes. For example:
- The Financials area includes fact tables for General Ledger transactions, cross-charge journals, currency revaluations, etc., plus dimensions for accounts, entities, periods, etc. [26].
- The Inventory area provides facts for inventory counts, adjustments, transfers, and snapshot facts for on-hand balances over time [27].
- The Sales (often called Opportunities or Orders) area contains facts summarizing sales orders, invoices, returns, etc., with customer and item dimensions.
Table 1 (below) summarizes key NSAW subject areas and their use cases. Each area comes with built-in measures (e.g. revenue, quantity on hand) and attributes (e.g. item name, department).
| Subject Area | Code | Business Purpose / Contents |
|---|---|---|
| Financials | NS_FINANCIALS | GL journals, budgets, currency adjustments, revenue recognition. Used for income statements, balance sheet analysis, budget vs actual. [28] [29] |
| Sales & Orders | various (e.g. NS_SO, NS_INV) | Sales Orders, Invoices, Customers, Items. Enables pipeline reports, sales trending, customer segmentation. (Not shown above, but typical NSAW content). |
| Inventory | NS_INVENTORY | Inventory counts, transfers, adjustments, valuations. Let’s managers analyze stock levels, turnover, and aging. [27] |
| Inventory Aging | NS_INVENTORY_AGING | Snapshot-based aging analysis, categorizing items by how long in stock. Useful for identifying slow-moving products. [30] |
| FSN Analysis | NS_INVENTORY_FSN | Fast/Slow/Non-moving inventory flags by period. Helps prioritize inventory management. [31] |
| Banking | NS_BANK | Bank transactions (deposits, payments, transfers, charges). Used for cash reconciliation and liquidity reporting. [32] |
| Expenses | NS_EMP_EXPENSES | Employee expense reports and snapshots. Enables reimbursement analysis and expense trend reports. [33] |
| Manufacturing | NS_MFG | Work orders, assembly builds/unbuilds, BOM usage. Supports production efficiency and work-in-process tracking. [34] |
| Manufacturing KPI | NS_MFG_INSIGHTS | KPIs like work-order completion rates, scrap rates. Provides performance metrics for shop floor. [35] |
| Others | … | Additional subject areas (e.g. Projects, Payroll, Campaigns) may be available depending on modules and licenses. |
Table 1: Examples of NSAW subject areas and their core reporting domains. (Source: Oracle NSAW documentation [36] [27].)
Each subject area typically contains one or more fact tables (machine-generated names ending with F or CF, for example CFSalesOrd for sales order facts) and dimension tables (with descriptive attributes). Fact tables are usually transactional (each row = a record of an event like a sales order line, GL entry, etc.) and often have corresponding snapshot or aggregate variants. Oracle’s documentation notes that fact tables may be supplemented by summary aggregate tables (suffix A) for faster queries [37].
Example: Inventory Snapshot Model
Consider the Inventory Snapshot area (NS_INVENTORY_SNAPSHOT), which the docs describe as capturing on-hand quantity/value daily [38]. The low-grain fact table (“Inventory Snapshot Fact”) might have columns like item_id, location_id, date_id, and measures like quantity_on_hand, total_value. Dimensions could include Item D, Location D, Time D (date) which describe product, warehouse, and time. This structure lets analysts trend inventory levels over time or compute turnover ratios. Similarly, the Inventory Turnover area has an aggregate fact (Inventory Turnover Analysis Fact) measuring how fast items sell [39].
Customization and Metadata
NSAW’s schema is metadata-driven and refreshes with each NetSuite release. Oracle provides downloadable data dictionaries (via the NSAW help center zipped files) that list all tables, columns, relationships and business meanings. Administrators can also view data lineage and table definitions from within NSAW’s metadata browser. Notably, Oracle warns that NSAW internally reloads tables (truncating them) as needed for performance [40], so designers should not rely on incremental UPDATE timestamps for long-term history. Instead, NSAW includes snapshot tables (as in Inventory Snapshot) for historical analysis.
Semantic Model and BI User Interface
NSAW is not just raw tables; it includes an entire semantic layer of metrics, dashboards, and visualizations built on top of the warehouse. In Oracle terminology, the presentation layer defines how subjects, metrics (KPIs), and filters are exposed to end users [14]. For example, NSAW may present pre-defined KPI cards (e.g. “Gross Margin %”) and decks (collections of cards) catering to roles like Finance Manager or Sales Director. These prebuilt analytics serve as a “factory schema” ready for instant use [41].
Figure 1 (earlier) described NSAW’s three-tier model: physical (ADW tables), logical (star schemas/business logic), and presentation (the OAC dashboards and cards). Oracle’s platform automatically generates a unified Data Model in OAC that users see as business concepts. For instance, the dimension "Customer" will have attributes (name, region, credit term, etc.) and will be joinable to multiple fact tables. Users need not craft low-level SQL; they build analyses by dragging fields and measures in OAC’s analysis builder or workbook interface.
Crucially, NSAW leverages Oracle’s collaborative BI features. Users can create interactive dashboards and workbooks in Oracle Analytics Cloud, share insights on KPIs, and even annotate reports for team discussions. The platform supports card and deck metaphors (akin to popular dashboards) with alerts and narrative capabilities. Analysts can also write custom SQL or use Oracle’s augmented Data Flow tools to transform data further, but many routine reports require little coding.
NSAW automatically recognizes hierarchies (e.g. account hierarchies, item categories) and multi-currency conversions based on NetSuite’s configuration. It also integrates seamlessly with NetSuite’s record metadata. For example, charts can be grouped by NetSuite’s own custom segments (like departments or classes) out-of-the-box. As Oracle notes, NSAW allows combining data across multiple NetSuite instances or subsidiaries, giving a true single source of truth view [4].
Semantic Content Catalog
The NSAW setup includes a “NetSuite Analytics Warehouse Data Model” reference. Here, users can browse all available metrics and dimensions. Each subject area comes with pre-built business questions and KPIs. For example, the Financials subject area might list questions like “What is our year-to-date gross profit?” along with the underlying measures and filters. These templates help ensure consistency in reporting enterprise-wide.
In addition to ready-to-use content, NSAW supports full SQL or SuiteQL querying on the warehouse tables. Business analysts comfortable with SQL can directly query ADW. However, the intended use case is that most users leverage the GUI-driven OAC tools. As Knute Holum of Myers-Holum observes: “NSAW is very user friendly; it’s meant for businesspeople and yet it offers a lot of flexibility” – users can build analyses in visual canvases without deep technical querying [42]. At the same time, OAC offers advanced features like machine learning modules, forecasting and graph analysis, all of which NSAW data can feed.
Integration with NetSuite UI
Oracle has also begun embedding NSAW analytics back into the NetSuite user interface. In recent updates, users can add links or portlets on their NetSuite dashboards that point directly to NSAW reports, providing a seamless experience [43]. Single sign-on is supported so that a NetSuite user can click an NSAW link without re-authentication [44]. This blurs the line between operational screens and rich analytics, ensuring executives see real-time metrics within the same platform.
BI Use Cases and Business Applications
NSAW enables a wide range of analytics use cases across finance, sales, operations, and beyond. By bringing together multiple data sources, NSAW expands reporting well beyond what SuiteAnalytics can do natively. This section explores the common use cases, organized by functional area, and illustrates how NSAW supports strategic decision-making.
Finance and Accounting
Financial reporting and analysis is a core NSAW use case. With all transactional data in the warehouse, finance teams can build comprehensive P&L, balance sheet, and cash flow reports that drill down into transaction details. NSAW’s Financials area includes granular GL data, budgets, and revenue recognition figures, enabling sophisticated financial modeling and trending [28] [29]. For instance, organizations use NSAW to analyze budget vs. actual comparisons across departments (the new “budget subject area” added in 2023 explicitly supports this) [29]. They can also examine KPIs like gross margin, EBITDA, and profitability by product line or region by joining sales, cost, and expense data.
The separation of analytics from transactions means large-scale historical analysis is feasible. A CFO can run quarterly or annual trend analyses on thousands of GL entries without hitting NetSuite’s performance limits. As Rand Group notes, this architecture allows “analyze large volumes of data, run complex queries, and explore trends over time without impacting day-to-day system performance” [4]. That capability is crucial for tasks like annual budget planning, financial consolidation across subsidiaries, and audit support.
Sales and Customer Analytics
Sales and marketing teams gain richer pipeline and customer insights with NSAW. While SuiteAnalytics can show current pipeline, NSAW enables analysis of historical sales performance, lead conversion rates, and cross-sell opportunities. By integrating CRM data (if available) or e-commerce orders into NSAW, companies get a unified view of customer activity. Use cases include:
- Sales Performance Dashboards: Track orders and revenue by sales rep, region, product line, and over time. Identify trends and seasonality by slicing data by month or quarter.
- Lead/Opp Conversion Funnel: Analyze conversion rates at each pipeline stage. Compare leads from different marketing campaigns.
- Customer Analysis: Segment customers by lifetime value, churn rate, or payment delinquency. NSAW can be used to compute Days Sales Outstanding (DSO) across entities using live aging data, for example.
Rand Group points out that NSAW’s automated daily extracts include custom fields, ensuring analytics “reflect how your business actually operates” [2]. A sales dashboard might include custom segmentation fields, credit terms, or partner channels that were previously difficult to incorporate.
Inventory and Supply Chain
Operations and inventory management see major gains from NSAW. Pre-built subject areas (Inventory, Inventory Aging, FSN, Turnover) provide analytics to track stock in real time and historically:
- Inventory Levels & Aging: Managers can run reports on on-hand quantities and values by location and date, even tracing how long items have sat in stock [30]. An Inventory Aging report may classify all inventory into aging buckets (0-30 days, 31-60 days, etc.) to spot stale stock.
- Turnover and FSN Analysis: NSAW can calculate inventory turns (COGS ÷ average inventory) by product line or warehouse [45], identifying slow movers (FSN: Fast, Slow, Non-moving items) across periods [31]. This is vital for demand planning and reducing holding costs.
- Order Fulfillment Trends: By blending sales order data with inventory, companies can analyze fulfillment cycles. For example, customer service dashboards might show average order-to-ship times or backorder rates.
BirdRock Brands, a high-volume retailer, exemplifies this use. With thousands of orders per day, BirdRock uses NSAW to track inventory in motion and forecast warehouse capacity [46]. The company’s NetSuite administrator notes that AI features in NSAW help “make more informed decisions based on patterns” in sales and inventory data [47]. Similarly, Overture Promotions improved supply chain planning using NSAW insights from sales and product data [48].
Operations and Manufacturing
For manufacturers, NSAW’s Manufacturing and Manufacturing KPI areas allow analysis of production and quality metrics. Key use cases include:
- Work Order Analysis: Track the number and status of open work orders, variances in build costs, and cycle times. By analyzing the Work Order facts, management can identify bottlenecks or cost overruns.
- Yield and Defect Rates: The Manufacturing Insights area provides measures like scrap rate and seconds per unit. Engineers can analyze what factors (e.g. shift, machine, operator) correlate with defects.
- Capacity Planning: Combining sales forecasts with inventory on hand and production lead time, NSAW can help forecast manufacturing load and required raw materials.
One example is a company using NSAW to optimize quality control. By analyzing the relationship between defect counts and production methods over time, the team improved its build status accuracy. In general, any scenario requiring analysis of transactions over long histories (multiple months of MRP data) is a fit for NSAW.
Executive Dashboards and Analytics
Beyond departmental reports, NSAW enables comprehensive executive dashboards. Because it brings together financials, sales, and supply chain, leaders can view enterprise KPIs in a single interface. Common C-level use cases include:
- Consolidated P&L and KPI Boards: A CFO or CEO can look at consolidated revenue, margins, cash flow, and other KPIs cross-company and cross-year. NSAW’s multi-entity support ensures subsidiaries roll up into corporate metrics.
- Alerting and Anomaly Detection: Using Oracle Analytics Cloud’s machine learning, NSAW can trigger alerts (e.g. sudden drop in margin, inventory shortages, employee expense spikes) based on pattern recognition. This proactive insight is far beyond what standard reports offer.
- Scenario Modeling: Because NSAW can be connected to planning tools, executives can run "what-if" scenarios (e.g. projecting revenue under different growth rates) using actual historical data as a baseline.
The pre-built dashboards in NSAW cover many of these executive needs out-of-the-box. However, users can also build customized BI content. For example, the CEO scorecard might include top 5 customer trends, market share analytics, and slack in working capital, all drawn from the warehouse tables.
Machine Learning and AI Use Cases
NSAW inherits AI and ML functionality from Oracle’s cloud stack. This opens advanced use cases:
- Forecasting: NSAW users can apply built-in time-series forecasting (part of Oracle Analytics’ ML) to sales, inventory consumption, or financial series. For example, the CFO of Overture Promotions noted using NSAW to “gain predictive insights from our sales trends… to inform our supply chain plans” [48]. This implies they may be using predictive analytics on sales data.
- Anomaly Detection: ML algorithms can scan transactional flows to flag irregularities (e.g. unusual expense patterns or sales outliers). Since NSAW centralizes data, anomalies across subsidiaries become visible.
- Classification & Clustering: Marketing may use NSAW to run clustering on customer data (e.g. segment high-value clients). Oracle’s guided ML flows can be used on the NSAW dataset to identify segments or propensity models.
As Myers-Holum points out, machine learning is “baked into both [ADW] and OAC,” making features like fraud detection or demand forecasting accessible to NSAW customers [49]. These high-end analytics were previously only in large ERP setups; NSAW democratizes them for NetSuite users.
SuiteAnalytics vs. NSAW: When to Use Each
It is important to contrast NSAW use cases with NetSuite’s native SuiteAnalytics. SuiteAnalytics (Live Search, Workbook) excels at real-time operational reporting inside NetSuite. It displays current data with minimal setup: dashboards showing cash position, open orders, inventory levels, etc., refreshed continuously (Source: annexa.com.au). As one analysis notes, SuiteAnalytics “offers embedded simplicity for operational insights” and requires no additional implementation (Source: annexa.com.au). It is ideal for daily decisions and monitoring, especially for KPIs like AR aging or inventory reordering points.
NSAW, on the other hand, is geared for strategic analytics and large-scale data crunching. As summarized in Table 2 below, the choice depends on needs:
| Capability | SuiteAnalytics (Builtin) | NetSuite Analytics Warehouse (NSAW) |
|---|---|---|
| Data Sources | Live NetSuite ERP data only; no external sources | NetSuite + external (CRM, eCommerce, external DBs, multiple NS instances) |
| Time Granularity | Real-time current and current year (limited history) [50] | Historical data (configurable start date) with snapshots for trend analysis |
| Data Volume | Limited to what live ERP can handle (millions of records can be slow) | Supports billions of rows; high-performance columnar storage [4] |
| Performance | Good for day-to-day analytics; complex reports can degrade system performance | Optimized for heavy analytics, complex joins, machine learning models |
| Analytics Scope | Operational KPIs, real-time dashboards (no data blending with other systems) | Enterprise-wide BI, cross-department and predictive analytics (Source: annexa.com.au) |
| Implementation Effort | Minimal (already in system); just build reports | Requires setup (feature enable, data load, config) [17] [22] |
| Skills Required | Business user or admin; point-and-click | BI/IT roles for setup; business users for building dashboards in OAC |
| Use Cases | Daily reports (cash, DSO, open SOs, etc.); cubes for quick slicing | Strategic planning; forecasting; cross-system reporting; large historical queries. |
Table 2: Comparing use cases for NetSuite’s built-in SuiteAnalytics versus NSAW. NSAW is not a replacement for real-time transactional reports, but rather an advanced BI system for enterprise analytics (source: industry blogs (Source: annexa.com.au) (Source: annexa.com.au).
In practice, most organizations use both in tandem. They rely on SuiteAnalytics for immediate operational needs (e.g. daily sales pipeline), and use NSAW for deeper monthly or quarterly analyses (e.g. sales trend versus marketing spend). The key is that NSAW removes the historical and performance limitations of SuiteAnalytics, enabling new strategic scenarios. As one columnist notes, NSAW is “a modern data warehouse and analytics solution built specifically for NetSuite customers” that moves users “from reactive reporting to proactive, data-driven decision-making” [51].
Data Analysis and Performance Considerations
Scalability and Performance
Oracle’s Autonomous Data Warehouse underpinnings give NSAW inherent scalability. It can elastically grow compute and storage to handle varying loads. Early benchmark studies (e.g. Oracle ADW vs Snowflake) suggest ADW performs very well on complex queries due to its columnar and in-memory optimizations [15]. Although no public benchmark exists specifically for NSAW (it was only released in 2021), the architectural claims have been borne out in customer experience. For example, one study notes that users see dashboards load “66% faster” with NSAW compared to older solutions [15], even though this is an indicative figure from related ADW tests.
High volumes of data are common in enterprise NetSuite accounts (hundreds of thousands of sales/invoice lines, millions of GL entries). NSAW’s daily incremental model ensures performance by only loading new or changed records each day. The use of ADW means data is compressed and partitioned for speed, and the Analytics Cloud can cache results for dashboards. That said, Oracle recommends that complex, ad-hoc analysis queries be tested for performance. Administrators can use the built-in Analyze SQL tool to tune queries or add indexes if needed (though ADW auto-tuning usually suffices).
Houseblend’s technical analysis notes that, despite NSAW’s novelty, “columnar systems are known to dramatically outperform row-based DBs on analytic workloads” [52], implying NSAW should greatly outpace SuiteAnalytics’ underlying row-oriented NetSuite DB. In sum, NSAW’s performance at scale is one of its chief advantages: it lifts analytics out of the ERP bottleneck.
Data Quality and Governance
Any data warehouse project must address data quality. NSAW inherits NetSuite’s data integrity but additional governance is advised when blending sources. Oracle provides features to mask or exclude personal information (PII) in NSAW datasets [19] (e.g. to ensure compliance with privacy laws). Role-based access in NSAW can restrict who sees sensitive facts; for example, a Sales head may see overall sales but not individual expense claim details.
Another consideration is master data consistency. For blended reporting (e.g. combining NetSuite financials with a separate CRM dataset), common dimensions (like currency, product codes) must align. Companies often use ETL processes or data mapping to reconcile these before loading to NSAW. The MHI blog highlights that NSAW partners are developing pre-built integrations (e.g. matching Oracle NetSuite ERP data with Salesforce) to streamline this consolidation [24].
Because NSAW is continually refreshed, errors in the source NetSuite data will propagate automatically. Therefore, ensuring the source suite data is clean (consistent coding, no orphan records) is critical. NSAW’s built-in subject areas often enforce referential integrity (fact tables only include valid dimension keys), but administrators must still monitor data schemas if custom fields or records change.
Case Studies and Real-World Examples
Several organizations have begun reporting tangible benefits from NSAW. These case studies illustrate how NSAW is applied in practice, with quantitative and qualitative results.
| Company | Industry | Use Case | Benefits / Outcome |
|---|---|---|---|
| Fellers (via Jade Global) [6] | Distribution (Wrap film) | Consolidating ERP & legacy data; exec dashboards | 35% faster processes, 50% less analysis time; unified sales & margin visibility. |
| Hygrade Components (via Equify Advisors) [7] | Manufacturing | Automating backlog reporting; CFO dashboard | Process changed from weekly manual report to daily automated BI tool; hours saved per week, deeper backlog insight. |
| BirdRock Brands [46] [47] | Retail (E-commerce) | Profitability forecasting; inventory planning | Uses NSAW to forecast profitability, track moving inventory; AI-driven insights improved decision speed. |
| Overture Promotions [48] | Retail/Marketing | Supply chain & sales analytics across end-to-end ops | Gained predictive sales insights, enhanced supply chain planning, proactive customer satisfaction improvements. |
| Terlato Wine Group [53] | Wine/Distribution | Consolidating multi-system data; strategic planning | NSAW “brings together all our data” and AI insights; improved understanding of sales trends; touted NSAW as “a game changer” for strategic insights. |
Table 3: Selected NSAW implementation case summaries (sources cited with specific results).
Fellers: Manufacturing Distributor
Jade Global published a detailed case study on Fellers, a producer of wrap films. Fellers had disparate legacy systems and poor reporting speeds. By implementing NSAW, Fellers established a single source of truth for product and financial data. Jade Global reports that Fellers achieved 35% more efficient processes and a 50% reduction in analysis time [6]. Executives could finally view real-time sales and margin dashboards. Importantly, this data consolidation allowed “more informed financial planning and strategic agility” in Fellers’ CEO’s words [6].
Hygrade Components: Manufacturing
Equify Advisors describes how they helped Hygrade (a components manufacturer) automate a critical sales backlog report. Previously, the CFO spent hours weekly manually compiling this report. After NSAW integration, Equify built an interactive dashboard. The update was transformative: the backlog report moved from a monthly/weekly chore to a daily intelligence tool, giving instant visibility. The CFO stated NSAW “completely transformed our reporting… I no longer spend hours each week compiling and validating backlog numbers; the data is always available at my fingertips.” [7]. In short, time savings were “countless hours,” and finance gained immediate insight.
BirdRock Brands: High-Volume Retailer
BirdRock (owner of popular lifestyle brands) processes thousands of transactions daily. In the NSAW announcement, BirdRock’s team reports using NSAW to “calculate and forecast profitability, track inventory in motion, and forecast warehouse capacity” [46]. The volatility of e-commerce demand meant BirdRock leveraged NSAW’s AI features to recognize patterns. Their NetSuite administrator, Celeste Chuberka, remarks that with NSAW’s AI, they can make “more informed decisions based on patterns and customer insights.” [47]. This has enabled BirdRock to respond faster to market trends and manage inventory more precisely.
Overture Promotions: Supply Chain Planning
Overture Promotions (a promotional products supplier) integrated its end-to-end data (from inventory to warehousing) in NSAW. Their CFO highlights that NSAW provides predictive insights from sales trends and channels, informing supply chain decisions to boost customer satisfaction [48]. With NSAW’s forecasts, Overture could proactively adjust production and stocking, rather than reacting to shortages. The NSAW dashboards also allow Overture to monitor key financial health indicators across their capital-intensive operations.
Terlato Wine Group: Enterprise Analytics
Terlato, a large wine distributor, uses multiple enterprise systems (NetSuite ERP, Salesforce CRM, etc.). According to NetSuite’s SuiteWorld PR, Terlato is using NSAW to unify all their data: “NetSuite Analytics Warehouse brings together all our data and leverages AI to provide clear insights to help us better understand sales trends and ensure resources are allocated to key growth areas. NetSuite has been a game changer…” [53]. In practice, they run cross-functional analyses (e.g. linking marketing promotions to sales performance) that were previously too cumbersome. NSAW’s AI-powered analytics help them spot sales trends and optimize staffing, inventory, and marketing spend.
Observations from Case Studies
Across these cases, common themes emerge:
- Time Savings: Companies consistently report significant reductions in manual analysis time (Fellers’ 50%, Hygrade’s many hours saved) [6] [7].
- Cross-System Visibility: NSAW’s ability to blend data (like Terlato and Overture have with CRM or SCM data) is repeatedly highlighted. Leaders value having one combined view of KPIs.
- Scalability: As these examples span small to mid-size enterprises, they show NSAW scales from hundreds of employees (Hygrade) to thousands of transactions daily (BirdRock).
- User Empowerment: Finance and operations users, not just IT, are quoted. The change of workflow is a key benefit (“white-collar automation”).
- Performance: Though not always quantified, the implication is that prior solutions (Excel, on-prem BI) could not match NSAW’s speed. Users emphasize “real-time” or near-real-time access after implementing NSAW, even for complex reports.
These case studies illustrate NSAW’s value proposition: delivering enterprise-grade analytics through a managed cloud platform, converting raw ERP data into immediate business insights.
Implications and Future Directions
Implications for Businesses
NetSuite Analytics Warehouse is reshaping how companies analyze ERP data. By providing a dedicated analytics environment, NSAW removes many technical and organizational roadblocks. The immediate implications include:
- Speed of Insight: Organizations can make faster decisions. For example, executives who once waited a week for consolidated reports now see dashboards daily. This increases responsiveness to market changes.
- Data Democratization: With a semantic layer and intuitive tools, domain experts (not just data scientists) can explore data. The equipment of drag-and-drop BI means more people can generate actionable reports.
- Process Efficiency: Automating formerly manual report generation (as Hygrade’s example shows) frees up staff for higher-value analysis, improving productivity.
- Competitive Advantage: As one NetSuite thought leader commented, NSAW “empowers teams to make smarter decisions with confidence” [54]. In competitive sectors, rapid data-driven insights can translate into better forecasting, optimization, and innovation.
- IT Strategy: For IT departments, NSAW lowers the maintenance burden of in-house BI infrastructure. Since ADW is autonomous, fewer resources are spent on tuning or scaling. Focus shifts to data governance and analytics strategy rather than DB administration.
Relation to the Broader Analytics Landscape
NetSuite Analytics Warehouse positions NetSuite (Oracle) as a more complete solution in the cloud analytics market. Where many organizations previously had to bolt on separate warehouse solutions (Snowflake, Redshift, Azure Synapse) to their ERP, NSAW offers a turnkey integrated option. This could slow migrations to third-party warehouses, keeping analytics “inside the Oracle stack.” It also aligns with the trend of BI bundled with applications (e.g., Salesforce’s Einstein Analytics, SAP BW/4HANA).
NSAW’s integration with Oracle Analytics Cloud also brings advanced features into the mature NetSuite customer base. For instance, customers can use Oracle’s new generative AI features on top of NetSuite data (via OAC) to auto-generate insights or natural-language queries. This is an exciting frontier: one could imagine asking NSAW in plain English, “What will our revenue be next quarter under each marketing scenario?” and getting a predictive answer. Oracle itself is pushing AI capabilities (the press releases mention AI connectors and AI innovations across NetSuite products [55]). Future NSAW versions will likely include more out-of-the-box AI like anomaly detection, predictive scoring, and automated narrative explanations on dashboards.
Standardization is another impact. NSAW’s pre-built schemas and KPIs encourage good practice (consistent definitions of metrics across business units). Companies can develop internal benchmarks (e.g. target margin %) and apply them systematically. Over time, a company’s data becomes more sharable (e.g. with partners or for M&A analytics) because of the common model.
Challenges and Considerations
Adopting NSAW also comes with considerations:
- Cost: NSAW is an add-on subscription to NetSuite and requires Oracle Cloud resources. Organizations must weigh ROI versus new expenses. However, the benefits (time saved, better decisions) often justify it for mid-to-large enterprises. Oracle’s pricing model (pay-per-use EDW compute and storage) should be transparent, but careful planning of compute budgets is needed for heavy usage.
- Change Management: Like any BI initiative, NSAW requires change in process and skills. Business users must learn the Oracle Analytics interface, and organizations need a governance process for developing new dashboards. We observed that many case studies engaged consulting partners for implementation (e.g. Jade Global, Equify). A formal project management approach is advised.
- Data Integration: The full power of NSAW comes when feeding in additional sources. Companies with multiple CRMs, WMS, or legacy systems will need data connectors. Oracle and partners are providing solutions (e.g. pre-built Salesforce connectors mentioned by Myers-Holum [24]), but integration still requires planning.
- Security and Compliance: While NSAW runs in Oracle Cloud with robust security, enterprises must ensure that regulatory requirements (e.g. GDPR) are met in the analytics layer. NSAW provides masking and age-out options, but these must be configured.
Future Directions
Oracle is clearly positioning NSAW as a strategic product. Future implications may include:
- Expanded Subject Areas: Just as HCM and CRM modules have analytical subject areas, NSAW may broaden to cover areas like service management, advanced shipping, or industry-specific models. Additional out-of-the-box KPIs (e.g. NetSuite Subscription Metrics released in late 2025 [56]) suggest a trend to vertical analytics packs.
- Deeper AI Integration: Expect more AI-driven insights baked into NSAW. For example, incorporating GPT-like summarizations of dashboards or automated anomaly alerts in the UI.
- Platform Convergence: As Oracle moves more NetSuite infrastructure onto Oracle Cloud (the Feb 2025 press notes migrating NetSuite to Autonomous Database [57]), NSAW could become even more integrated – possibly using real-time change streams rather than daily batches.
- Third-Party Ecosystem: Independent software vendors (ISVs) may emerge to provide specialized NSAW content (e.g. retail demand forecasting modules). The Oracle community could foster marketplaces of NSAW dashboards and data models.
- Cross-Cloud Connectivity: NSAW might evolve to easily federate with data in other clouds (Azure Blob, AWS S3) for truly cross-cloud analytics, especially as companies adopt multi-cloud strategies.
Conclusion
NetSuite Analytics Warehouse represents a significant advance in enterprise analytics for the NetSuite ecosystem. As a purpose-built, cloud-native data warehouse, it empowers organizations to go beyond the limitations of transactional reporting and realize the full potential of their data. Through automated data integration, high-performance storage, and a rich semantic model, NSAW has demonstrated measurable benefits: from halving analysis time to enabling entirely new insights across departments.
While NSAW continues to mature, its impact is already evident. Companies like Fellers, Hygrade, BirdRock, and others have harnessed NSAW to streamline processes, support strategic planning, and gain competitive advantages. Oracle’s ongoing enhancements – adding AI-features, expanding global availability, and deepening NetSuite integration – suggest that NSAW will remain a core part of the NetSuite roadmap.
In the evolving landscape of cloud BI, NSAW helps Oracle NetSuite customers catch up. It brings modern data warehouse capabilities into ERP analytics, aligning NetSuite with the “modern data estate” architectures prevalent in the industry.
For organizations, the message is clear: if your analytics needs have outstripped what SuiteAnalytics can deliver, NSAW offers a robust path forward. By creating a single source of truth and leveraging advanced analytics tools, companies can transform raw data into actionable intelligence. In the words of Oracle NetSuite executives, NSAW turns data “into actionable insights” [4] and enables businesses to innovate and grow with confidence [12].
References
- Oracle NetSuite Documentation, Introduction: Overview (2023) [58]
- Oracle NetSuite Help, Enabling NetSuite Analytics Warehouse (2023) [25]
- Oracle NetSuite Help, Setting Up the Data Transfer (2023) [22]
- Oracle NetSuite Help, Performance Benchmarking and Analysis, (Houseblend quoting Oracle ADW) [15]
- Rand Group, Karishma Anand (2026), “What is NetSuite Analytics Warehouse?” [4] [2]
- Myers-Holum (MHI) Interview (2021), NSAW Aims to Make Your Analytics Easier [59] [49]
- Jade Global Case Study, “NetSuite Analytics Warehouse for Fellers” [6]
- Equify Advisors Blog, “Enterprise Reporting, Reimagined with NSAW: Hygrade Success Story” [7]
- Oracle PR Newswire (Oct 19, 2021), “NetSuite Analytics Warehouse Helps Organizations Unlock New Opportunities” [1]
- Oracle PR Newswire (Oct 17, 2023), “NetSuite Extends Analytics Warehouse to… AI features” [12] [46]
- Oracle PR Newswire (Sep 28, 2022), “NetSuite Enhances Analytics Warehouse to… Maximize the Value of Data” (Source: annexa.com.au) (Summarized)
- Katoomi Blog (2025), “NetSuite Analytics Warehouse: A Technical Overview” (background architecture) [3]
- Houseblend (2025), “NSAW: Technical Guide & Benchmark” (performance insights) [15] (for context)
- Annexa (2025), “SuiteAnalytics vs NSAW” (features comparison) (Source: annexa.com.au) (Source: annexa.com.au)
External Sources
About Houseblend
HouseBlend.io is a specialist NetSuite™ consultancy built for organizations that want ERP and integration projects to accelerate growth—not slow it down. Founded in Montréal in 2019, the firm has become a trusted partner for venture-backed scale-ups and global mid-market enterprises that rely on mission-critical data flows across commerce, finance and operations. HouseBlend’s mandate is simple: blend proven business process design with deep technical execution so that clients unlock the full potential of NetSuite while maintaining the agility that first made them successful.
Much of that momentum comes from founder and Managing Partner Nicolas Bean, a former Olympic-level athlete and 15-year NetSuite veteran. Bean holds a bachelor’s degree in Industrial Engineering from École Polytechnique de Montréal and is triple-certified as a NetSuite ERP Consultant, Administrator and SuiteAnalytics User. His résumé includes four end-to-end corporate turnarounds—two of them M&A exits—giving him a rare ability to translate boardroom strategy into line-of-business realities. Clients frequently cite his direct, “coach-style” leadership for keeping programs on time, on budget and firmly aligned to ROI.
End-to-end NetSuite delivery. HouseBlend’s core practice covers the full ERP life-cycle: readiness assessments, Solution Design Documents, agile implementation sprints, remediation of legacy customisations, data migration, user training and post-go-live hyper-care. Integration work is conducted by in-house developers certified on SuiteScript, SuiteTalk and RESTlets, ensuring that Shopify, Amazon, Salesforce, HubSpot and more than 100 other SaaS endpoints exchange data with NetSuite in real time. The goal is a single source of truth that collapses manual reconciliation and unlocks enterprise-wide analytics.
Managed Application Services (MAS). Once live, clients can outsource day-to-day NetSuite and Celigo® administration to HouseBlend’s MAS pod. The service delivers proactive monitoring, release-cycle regression testing, dashboard and report tuning, and 24 × 5 functional support—at a predictable monthly rate. By combining fractional architects with on-demand developers, MAS gives CFOs a scalable alternative to hiring an internal team, while guaranteeing that new NetSuite features (e.g., OAuth 2.0, AI-driven insights) are adopted securely and on schedule.
Vertical focus on digital-first brands. Although HouseBlend is platform-agnostic, the firm has carved out a reputation among e-commerce operators who run omnichannel storefronts on Shopify, BigCommerce or Amazon FBA. For these clients, the team frequently layers Celigo’s iPaaS connectors onto NetSuite to automate fulfilment, 3PL inventory sync and revenue recognition—removing the swivel-chair work that throttles scale. An in-house R&D group also publishes “blend recipes” via the company blog, sharing optimisation playbooks and KPIs that cut time-to-value for repeatable use-cases.
Methodology and culture. Projects follow a “many touch-points, zero surprises” cadence: weekly executive stand-ups, sprint demos every ten business days, and a living RAID log that keeps risk, assumptions, issues and dependencies transparent to all stakeholders. Internally, consultants pursue ongoing certification tracks and pair with senior architects in a deliberate mentorship model that sustains institutional knowledge. The result is a delivery organisation that can flex from tactical quick-wins to multi-year transformation roadmaps without compromising quality.
Why it matters. In a market where ERP initiatives have historically been synonymous with cost overruns, HouseBlend is reframing NetSuite as a growth asset. Whether preparing a VC-backed retailer for its next funding round or rationalising processes after acquisition, the firm delivers the technical depth, operational discipline and business empathy required to make complex integrations invisible—and powerful—for the people who depend on them every day.
DISCLAIMER
This document is provided for informational purposes only. No representations or warranties are made regarding the accuracy, completeness, or reliability of its contents. Any use of this information is at your own risk. Houseblend shall not be liable for any damages arising from the use of this document. This content may include material generated with assistance from artificial intelligence tools, which may contain errors or inaccuracies. Readers should verify critical information independently. All product names, trademarks, and registered trademarks mentioned are property of their respective owners and are used for identification purposes only. Use of these names does not imply endorsement. This document does not constitute professional or legal advice. For specific guidance related to your needs, please consult qualified professionals.