IFRS 18 Income Statement: Categories, Subtotals & MPMs
IFRS 18 - Income Statement Presentation: Categories, Subtotals & MPMs
Executive Summary
IFRS 18, Presentation and Disclosure in Financial Statements, is a landmark new standard issued by the IASB (effective January 1, 2027) that fundamentally restructures the income statement. It replaces key portions of IAS 1 and introduces five prescribed categories (Operating, Investing, Financing, Income Taxes, Discontinued Operations) and strictly defined subtotals to ensure consistent reporting of financial performance [1] [2]. In particular, IFRS 18 mandates two new subtotals – Operating profit and Profit or loss before financing and income taxes – to improve comparability across entities [3] [4]. At the same time, IFRS 18 imposes detailed disclosure requirements for management-defined performance measures (MPMs) – measures of profit or loss used by management (e.g. EBITDA, adjusted profit) that are not defined in IFRS – requiring clear labelling, calculation detail, and reconciliation to IFRS-defined metrics [5] [6]. Additional principles on aggregation/disaggregation of line items ensure that income statement line items are meaningfully grouped and not hidden in vague “other” categories [7] [8].
This report examines IFRS 18 in depth. We provide background on the history and rationale for reforming IAS 1, then analyze each aspect of the new income statement presentation: the five categories of income and expense; the required and optional subtotals; the strict rules for classifying and presenting operating expenses; and the comprehensive regulations around MPMs. We compare the IFRS 18 regime to prior practice, highlighting implications for finance teams, analysts, and stakeholders. The analysis draws on IFRS 18’s official pronouncements [9] [3], guidance from major audit and advisory firms [10] [6], and practical examples from illustrative financial statements (Source: www.pwc.ch) [11]. We include case examples and consider impacts on performance analysis, debt covenants, and financial reporting quality. Overall, our findings emphasize that IFRS 18 should greatly enhance comparability and transparency in performance reporting, but requires significant transitional work (restating comparatives, remapping data systems, revising KPIs by preparers [12] [13].
Introduction and Background
IAS 1 – Presentation of Financial Statements – has guided income statement formats for decades, but provided broad flexibility in labeling and aggregating items. Over time, this flexibility led to divergences in practice: many companies presented non-IFRS subtotals (like EBIT or EBITDA) or varied definitions of common measures such as “operating profit,” making cross-company comparison difficult [14] [15]. The IASB’s project culminating in IFRS 18 responds to market demand for consistency and transparency. As the IASB stated, IFRS 18 aims to give “investors more transparent and comparable information about companies’ financial performance” [1]. In short, IFRS 18 enforces a more structured income statement, with mandatory subtotal definitions and tighter grouping rules.
Notably, IFRS 18 does not alter recognition or measurement of revenues and expenses; net profit remains unchanged. Instead, it restructures presentation only. For example, IASB documentation makes clear that IFRS 18 “will have no impact on the group’s net profit” – only on how those results are organized on the face of the income statement [16] [2]. In other words, IFRS 18 brings changes in format and disclosures (categories, subtotals, note disclosures) without changing the underlying calculations of profit. Historical context underscores the uniqueness of this overhaul: IAS 1 was originally issued in 2001 and amended in 2003, 2007, 2011 and later years, but all those changes focused on minor enhancements (e.g. other comprehensive income, equity statements).IFRS 18 is effectively a new standard replacing IAS 1 for profit or loss presentation [17].
In summary, IFRS 18 reflects the IASB’s response to research and investor feedback about the shortcomings of income statement comparability under IAS 1. Investors had to guess how different firms defined operating profit or EBITDA; IFRS 18 now requires that such measures, if used, be labelled as management measures with full reconciliation to IFRS-defined lines [5] [6]. By dictating income and expense categories and key subtotals, IFRS 18 “ushers in the most significant change to the statement of profit or loss since IFRS was introduced,” according to commentaries. We now examine IFRS 18’s changes in detail.
Five New Income Statement Categories
Overview of Categories
Under IFRS 18, all items in the statement of profit or loss must be allocated to one of five categories.These are: the Operating category, Investing category, Financing category, Income Taxes category, and Discontinued Operations category [18] [3]. The first three (Operating, Investing, Financing) are new and explicitly defined; the latter two follow existing standards (IAS 12 Income Taxes; IFRS 5 for discontinued operations). In effect, Operating, Investing and Financing replace the old bifurcation of costs by nature or function – now every profit/loss line is assigned by the nature of the business activity it arises from, as described below.
Briefly, the Operating category is the “default” category for items arising from an entity’s main business, plus any items not falling into the other categories. The Investing category includes items arising from stand-alone investment assets (e.g. separate investments in securities or property held to earn returns) and earnings from equity-accounted associates or joint ventures. The Financing category covers income/expense from financial liabilities generally used to raise capital (e.g. interest on bank loans or bonds, unwinding of discounts on liabilities, interest on lease obligations). Income and expenses from IAS 12 (income taxes) are shown in the Income Taxes category. Finally, any income or expense from a discontinued component of business (per IFRS 5) is shown in the Discontinued Operations category. All income/expense on the face of profit or loss is placed into exactly one of these categories [18] [3].
Table 1 below summarizes these categories along with typical example line items:
| Category | Typical line items included |
|---|---|
| Operating | Revenue and expenses from the entity’s main business (e.g. sales revenue, cost of goods sold, selling & administrative costs); plus any other items not classified elsewhere (e.g. impairment losses on operating assets, certain provisions). For most companies this is the largest block of items, reflecting core operating profit [18] [19]. |
| Investing | Income and expenses from investments and stand-alone assets (e.g. dividend income, interest from investment securities, rental income from investment property) and share of profits/losses of associates and joint ventures. Also includes gains or losses on sale of investments or investment property, or fair value changes on such assets [20] [21]. |
| Financing | Interest and financing costs on liabilities used solely for raising finance (e.g. interest on bank loans, bonds); also interest income on financing receivables (e.g. unwinding of pension liabilities or discounts). In addition, financing fees or costs related to liability S (like debt issuance costs). If the company’s core business is providing finance (e.g. banks), some of these items may be shifted to Operating (see below) [22] [23]. |
| Income Taxes | Income tax expense or benefit (per IAS 12) and related foreign exchange effects. (IAS 12 requires all income tax on P&L items to be shown below the operating/investing/financing lines; IFRS 18 simply formalizes this into its own category [24].) |
| Discontinued Operations | Any P&L items relating to discontinued operations (as defined by IFRS 5). This includes both revenues and expenses of the discontinued component, and any gains or losses on disposal of the discontinued group. All such items are presented separately as “Discontinued operations” in the income statement, as per IAS 1/IFRS 5 rules [25]. |
Table 1: IFRS 18 income statement categories and example line items **(based on IFRS 18 guidance [18] [20] and illustrative sources).
Operating Category – the Residual Business Category
The Operating category is effectively residual: it includes all income and expenses stemming from the entity’s primary business activities, plus anything not already captured by Investing, Financing, or Taxes [26] [4]. In IFRS 18’s own words, it “reflects the results of a company’s main operations” and consists of “all income and expenses not classified in the other categories” [4] [27]. Thus, a manufacturer would include its sales, cost of sales, SG&A, R&D, impairments of production assets, etc. in Operating; a retailer would include merchandise revenue and store expenses; a tech firm would include its software sales and operating R&D/driving costs. Even unusual or non-recurring items remain in Operating if they don’t fall into Investing/Financing (IFRS 18’s guidance explicitly states it “does not exclude volatile, unusual or non-recurring items” (Source: www.leash.co.za). In short, Operating is the “everything else” bucket that shows core profit from business operations, and it forms the starting point for cash flow analysis. [21] [4].
However, IFRS 18 introduces important nuances for entities whose main business is investing or financing. If an entity’s primary activity is investing (e.g. an investment company or property equity firm), then many items that would normally go in Investing are deemed part of its operating business and thus move into Operating. Likewise, if providing financing (e.g. a bank) is the main activity, items normally treated as financing become operating. The standard states that entities with such “specified main business activities” should report the related income and expenses in Operating to ensure operating profit truly reflects the core activity [28] [22]. For example, a real estate company that essentially invests in rental properties must show rental income, property revaluation gains, etc. as operating – even though those are “investment income” for many industries [29] [27]. Similarly, a bank that lends to customers would include interest on loans and related earning in Operating. IFRS 18 thus tailors classification to industry context: it preserves comparability by allowing the “main business” items to stay in Operating.
Investing Category – Income on Standalone Assets
The Investing category is narrower: it covers income and expenses arising from assets that are held for yield rather than core operations. It includes (a) earnings on investment securities and cash equivalents held by the company, (b) income from assets that generate returns largely independently (e.g. dividends, rental on investment property, interest on financial assets), and importantly (c) the share of profit or loss from equity-accounted associates and joint ventures [20] [21]. The latter was previously often in Operating, but IFRS 18 explicitly reclassifies it to Investing [30] [20]. In practice this means a group’s operating profit will exclude equity method results; instead those results appear under Investing. Also in Investing go realized/unrealized fair value changes on investments (e.g. gains on sale of securities) and foreign exchange differences on investment assets.
If an entity’s main business is investing, IFRS 18 still places some of that within Operating (as noted above), but all other investment returns go in Investing. For example, a non-investment firm holding excess cash would report cash interest in Investing (whereas a bank reports interest in Operating). The key test is whether an asset “generate[s] returns on its own, independently of the entity’s other resources” [31]. If so, income from it goes to Investing.
Financing Category – Cost of Funds
The Financing category is complementary. It includes items related to the cost or benefit of raising capital through debt or similar financing. Typical items are interest expense on bank loans, bonds, lease liabilities, or any other financing liability. Also included are fair value losses (or gains) on debt instruments (if they are used to raise finance) and unwinding of discount on liabilities such as obligations or lease liabilities [32] [33]. In short, Financing covers finance charges and related effects. Dividends on issued instruments that are classified as liabilities (e.g. preferred shares payable) also count as financing cost.
Similar to Investing, if financing-to-customers is a company’s core business, those interest items go into Operating instead [22] [27]. Otherwise, any interest income or expense on borrowings sits here. For example, a manufacturing firm’s interest on its loan is in Financing; an insurance company’s interest on policyholder liabilities likewise. Importantly, any interest related to contract or pension liabilities (e.g. unwinding of provisions) is always in Financing, except for service costs which remain in Operating [34].
Income Taxes and Discontinued Operations
IFRS 18 puts all income tax expense items (IAS 12) into one distinct Income Taxes category. This includes not only current and deferred tax on operating/investment profits but also currency translation effects attributable to taxes [24]. There is no discretion here – taxes must be segregated to show pre- and post-tax profits clearly.
Similarly, any income/expense from a discontinued operation is segregated into the Discontinued Operations category, following IFRS 5 rules [25]. This ensures that discontinued items do not distort the comparison of continuing operations.
In summary, IFRS 18’s five-category structure is intended to standardize how income and expense are grouped: operating performance (what management controls via core business) versus returns on investment versus financing costs, plus clear separation of tax and disposal items [3] [4]. This categorization is illustrated in Table 1 above and is compulsory for all IFRS reporters under the new standard [3] [20].
Mandatory and Common Subtotals in IFRS 18
New Required Subtotals
One of IFRS 18’s most notable features is its mandatory subtotals. Previously, IAS 1 allowed entities to pick any useful subtotals (EBITDA, gross profit, etc.) with only net profit, profit before tax, and earnings per share mandated [35]. IFRS 18 now defines and requires two specific subtotals on the profit or loss face:
-
Operating profit or loss – the total of all Operating category items. Formally: net profit from operating activities after all operating expenses and incomes. By definition it excludes finances and taxes. IFRS 18 “mandates the presentation of two new subtotals... Operating profit or loss” [4]. In practice, “Operating profit” will be the sum of sales minus all operating costs, etc., with equity-accounted profits excluded (since those are now Investing).
-
Profit or loss before financing and income taxes – effectively equivalent to EBIT in substance. IFRS 18 defines this as Operating profit + Investing category income/expenses. In other words, it is the total of the Operating and Investing categories, before any Financing or Tax items. Officially: “Profit or loss before financing and income taxes: … calculated as operating profit or loss plus all income and expenses classified in the investing category” [4].
IFRS 18 requires that these two subtotals be presented on the face of the statement of profit or loss [36] [4]. This ensures every company shows the performance from core operations and from recurrent investing assets on a comparable basis, before the effects of financing and taxes. The IASB emphasizes that these “defined subtotals [provide] a consistent structure... across all entities” [4].
The inclusion of Operating profit as a required subtotal is particularly significant. Under IAS 1, “operating profit” was not standard – companies defined it ad hoc. In practice this meant that analysts struggled to compare operating profit across firms; one study found 61 of 100 companies used at least nine different definitions of operating profit [15]. By defining it explicitly (as total operating income less operating expenses), IFRS 18 eliminates that ambiguity. Commentators note that “operating profit is one of the most frequently used subtotals” but had lacked an IFRS definition [15]. With IFRS 18, operating profit will now have a uniform meaning: all income/expenses not in Financing or Taxes [4] [15].
The second subtotal, profit before financing and taxes, similarly provides a standardized “EBIT”-type measure. In effect, that line aggregates investing returns with operating profit, giving investors a clear view of profitability excluding financing and taxes. Together, these two new mandated subtotals anchor the income statement structure. As IFRS 18’s proponents note, they help investors forecast cash flows and profit margins by starting with consistent base figures [36] [15].
Other Subtotals (Optional)
Beyond these mandated lines, entities may present additional subtotals where useful and not misleading. Commonalities with prior practice remain. For instance, companies often still show Gross profit (revenues minus cost of goods sold) and Profit before income tax even under IFRS 18 if these help in understanding performance. However, IFRS 18 makes it clear these are not required by the standard [35]. The ACCA guidance notes explicitly that “Gross profit and profit before income taxes are not mandatory subtotals” under IFRS 18, although many companies will continue to show them for the sake of a “useful structured summary” [35].
Similarly, traditional line items like Revenue, Cost of Sales, SG&A, R&D, etc., remain as line items – IFRS 18 does not eliminate any individual heading that was allowable under IAS 1. It simply places them within the new categories and requires any new subtotal lines. For example, if an entity presented EBITDA or EBIT internally (outside the IFRS financial statements), IFRS 18 would treat these as management-defined performance measures (MPMs) requiring disclosure (see next section) rather than official subtotals.
Table 2 summarizes IFRS 18’s required subtotals versus commonly used additional subtotals:
| Subtotal | Required by IFRS 18? | Comments / Synonyms |
|---|---|---|
| Operating profit (loss) | Yes (mandatory) | Defined as operating income (revenues) minus all operating expenses. (Comparable across companies now.) [4] |
| Profit or loss before financing & tax | Yes (mandatory) | Comparable to “EBIT” or “Profit before Interest & Tax.” It equals operating profit plus investing income/exp. [4] |
| Gross profit (Revenue – COGS) | No (optional) | Commonly shown but not required. Illustrative firms often include it for useful analysis [35]. |
| Profit or loss before income tax | No (optional)* | Not mandated under IFRS 18. Many entities still present this prior to the tax category [35]. |
| Profit or loss (Net income) | Yes (final total) | Mandatory as the final net profit/loss after all items and tax. |
Table 2: IFRS 18 subtotals – required vs optional (sources: IFRS 18 guidance [4] [35]).
Key Note: IFRS 18’s mandatory subtotals must appear on the face of the P&L. They are on equal footing with any other primary line item totals. Any additional subtotals (like Gross profit) must not be more prominent and must include only IFRS-measured amounts [36].
Reclassification of Equity-Method Income
A direct consequence of the new categories is that equity-accounted profits/losses (from associates/joint ventures) move from Operating to Investing. Prior IAS 1 practice often placed “share of profit of associates” in operating profit. IFRS 18 explicitly prohibits this: equity investments are part of Investing, since returns on investments belong there. The KPMG IFRS commentary notes that “results of equity-accounted investments should no longer be shown in operating profit; instead they should always be reported under the investing category” [30]. In sum, operating profit will generally exclude share-of-profit (these are lumped in the investing category’s total). This shift underscores IFRS 18’s logic: earnings from investors’ stakes are not part of core business operations (except when investing is the primary activity, see above) [30] [4].
Classification and Presentation of Operating Expenses
Within the Operating category, IFRS 18 retains the choice of nature vs function presentation for expenses (as IAS 1 did). Entities can continue to present operating expenses either by their nature (depreciation, materials, payroll, etc.) or by function (cost of sales, selling, admin, R&D, etc.), or a mixed approach [37]. IFRS 18 requires that whatever approach is chosen, it must give a “useful structured summary” of expenses [37]. Notably, if function format is used, cost of sales must still be shown separately (consistent with IAS 1 practice) and the nature of each function line must be disclosed in the notes [37].
A new element is enhanced note disclosure for Operating expenses by nature. IFRS 18 specifically requires a quantitative and qualitative breakdown of five broad nature categories as a minimum: (1) Depreciation (of PP&E, investment property, right-of-use assets), (2) Employee benefits, (3) Advertising, (4) Research and Development, and (5) Restructuring costs [38]. In one consolidated note, the entity must explain what each of these categories means (e.g. what kinds of expenses are included in “employee benefits”) and how much each totaled during the period. This ensures transparency: even if the primary statement uses function-based lines, investors can see major expense types.
In practice, this means preparers may need to restructure accounting systems to tag expenses into these five buckets. The aim is to prevent, say, all significant restructuring or R&D costs from being buried in a generic “other operating expenses” line. IFRS 18’s disaggregation rules further push towards this transparency (see next section).
In summary, IFRS 18 does not ban any previously allowed expense classification, but it strengthens requirements around how those expenses are grouped and disclosed. Every operating cost is still present, but preparers must disclose certain key nature amounts and ensure their grouping reflects an informative structure [37] [7].
Management-Defined Performance Measures (MPMs)
A hallmark of IFRS 18 is its treatment of non-IFRS KPIs, termed “Management-Defined Performance Measures” (MPMs). An MPM is broadly defined as a subtotal (or total) of income and expense that is not specified by IFRS but is used by management in external communications to highlight some aspect of performance [19] [39]. In simpler terms, these are what many call “alternative performance measures” (APMs) – metrics like EBITDA, adjusted operating profit, free cash flow, etc. – that companies often report in MD&A, press releases or investor calls. IFRS 18 requires any such measure that meets the definition to be treated carefully in the financial statements.
Specifically, disclosure requirements for MPMs under IFRS 18 are strict and detailed. If an entity reports a performance measure outside the financial statements (in management commentary or investor materials) that is not an IFRS-defined subtotal in the primary statements, and is used to communicate performance of the entity as a whole, it is an MPM [19] [39]. Once an MPM is identified, IFRS 18 mandates:
- Clear Label and Explanation: The MPM must be clearly named (e.g. “Adjusted EBITDA” or “Free Cash Flow”) and defined. A note must explain what aspect of performance the measure represents and why management believes it is meaningful [6].
- Calculation Details: The entity must show exactly how the MPM is calculated (e.g., starting point, adjustments added or removed). This “transparency” requirement was specifically cited by the IASB as addressing investor concerns about undisclosed adjustments [40] [6].
- Reconciliation: Crucially, IFRS 18 requires a reconciliation of each MPM to the closest IFRS-subtotal. This means the note must link every component of the MPM back to line items in the IFRS income statement. For example, if an entity reports “adjusted operating profit”, it must show how that relates line-by-line to the IFRS 18 Operating profit [6] [41]. All differences (additions/deductions) must be itemized, and the effects of tax and NCI on those adjustments must be disclosed.
- Single Note: All MPM disclosures are consolidated in a single note (much like how IAS 1 collects policies and estimates). Audit scope extends to these disclosures, meaning MPMs will effectively be subject to the same rigor as IFRS figures [6] [5].
Common examples of MPMs include: “Adjusted profit for non-recurring items,” “EBITDA” (often labelled as operating profit before depreciation/amortization), “Free cash flow,” or any version of “Adjusted” profit or operating profit [42] [43]. Notably, IFRS 18 clarifies that non-financial KPIs (like carbon emissions) are not MPMs. Also excluded are broad financial metrics that are not sums of P&L items (e.g., return on equity or debt ratios). Only subtotals of income/expense fall under the MPM rules [43].
By imposing formal disclosure on MPMs, IFRS 18 implicitly acknowledges that companies routinely use such metrics while bringing them onto the published financial statements’ radar. Industry commentaries note that, under IFRS 18, almost any common non-IFRS profit measure (e.g. EBITDA) will need to meet these disclosure requirements if it’s used externally. This shift will force greater discipline: an entity can no longer casually cite an “adjusted net profit” figure without explaining it in the financial statements. The IASB emphasizes that IFRS 18 will make MPMs “subject to audit” and provide a “better basis for analysis” by investors [40] [6].
Example: A hypothetical company reports “Adjusted Operating Profit” of $X in its annual report narrative. Under IFRS 18, the financial statements must include a note stating clearly what that means (which items were adjusted out), why it is used, and a reconciliation from IFRS Operating Profit to Adjusted Operating Profit. If the adjustment included, say, “one-time litigation expense”, that amount and its tax/NCI effect must be shown explicitly.
Aggregation and Disaggregation Principles
Beyond specifying which items go in which category and what subtotals to present, IFRS 18 also strengthens the guidance on how to group line items. The goal is clarity: avoid hiding material details or overwhelming users with too many trivial lines. IFRS 18 declares that items should be aggregated only with other items that have similar nature or function [7] [8]. Conversely, “dissimilar” items must be shown separately. Itemization should ensure material information is conveyed.
In practice, this means generic labels like “Other operating expenses” should not be a catch-all for dissimilar amounts (unless truly minor). For example, you could group all related selling costs together, but if a single type of expense (say a large impairment) is material, it should be broken out of “operating expenses” into its own line or clearly described. IFRS 18 explicitly discourages vague “Other” categories and requires disaggregation of non-recurring or unusual items, either on the face of the statement or in the notes (perhaps via MPM disclosure) [7] [8].
Overall, the “aggregation/disaggregation” concept under IFRS 18 mirrors the qualitative characteristics of financial reporting (relevance and understandability) as laid out in the conceptual framework. IFRS 18’s draft explanation states that presenting a subtotal must not obscure material information, nor should excessive detail flood the statements. Entities should apply judgment, often guided by the new subtotals. For instance, all items in the Operating category that sum up to the mandated Operating Profit must either appear as separate lines (if significant) or be aggregated under descriptive headings consistent with their nature/function. Any restatements of comparatives must reflect the same detailed grouping rules to remain comparable.
Illustrative Income Statement Examples
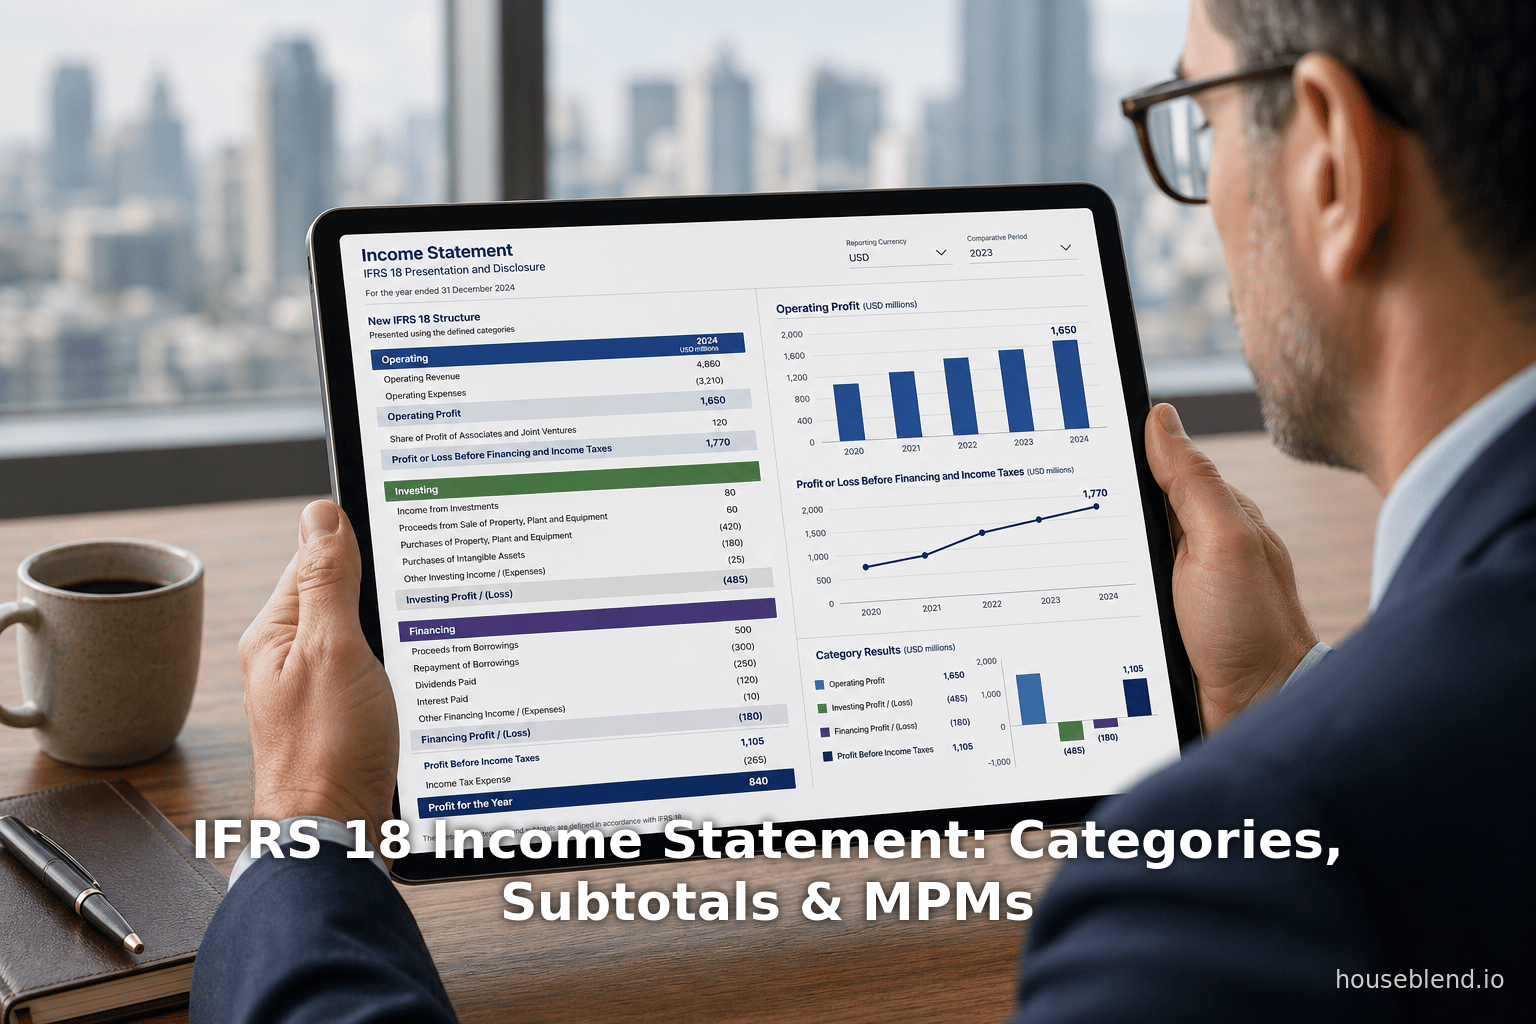
To bring the above concepts to life, consider how an IFRS 18-compliant income statement might look. While IFRS 18 does not prescribe exact line item names (except subtotals), illustrative statements have been published to guide practice. Table 3 below sketches a simplified example of a company’s income statement under IFRS 18, highlighting the categories and subtotals. (All figures are for illustration; actual entity layouts will vary.)
| Item | Amount (USD) | Category | Subtotal |
|---|---|---|---|
| Revenue (net sales) | 500,000 | Operating | |
| Cost of goods sold | (300,000) | Operating | |
| Gross profit | 200,000 | (Operating subtotal) | Operating profit: |
| Selling & distribution expenses | (30,000) | Operating | |
| Administrative expenses | (50,000) | Operating | |
| R&D expenses | (10,000) | Operating | |
| Impairment loss (asset) | (5,000) | Operating | |
| Operating profit (loss) | 105,000 | Operating | 105,000 |
| Share of profit of associates | 8,000 | Investing | |
| Interest income (investments) | 2,000 | Investing | |
| Interest expense (non-operating debt) | (5,000) | Investing or Financing | |
| Profit (loss) before financing and income taxes | 110,000 | (Op + Investing subtotal) | 110,000 |
| Interest expense (short-term borrowings) | (20,000) | Financing | |
| Foreign exchange loss (on borrowings) | (2,000) | Financing | |
| Profit (loss) before income tax | 88,000 | (Op+Invest+Financing) | |
| Income tax expense | (22,000) | Income Taxes | |
| Profit (loss) from continuing operations | 66,000 | After all categories | |
| Profit (loss) from discontinued operations (net of tax) | 4,000 | Discontinued Operations | |
| Profit (loss) for the period | 70,000 | (All categories) | 70,000 |
Table 3: Sample Format of a Statement of Profit or Loss under IFRS 18. Each line item is assigned to its IFRS 18 category, and the two required subtotals are shown in bold. (This example is illustrative; actual financial statements may include additional lines and subtotals as needed.)
In this example, line items like “Revenue, COGS, SG&A, R&D” are all in the Operating category. We compute Operating profit as 105,000 (the mandatory subtotal). Below operating profit, we see items from the Investing category (share of profit, interest on investments) and then “Profit before financing and income tax” at 110,000. Next come the Financing items (interest on debt), leading to “Profit before tax” of 88,000. Income tax (Income Taxes category) is then subtracted to reach 66,000 profit from continuing operations. Discontinued results (4,000) are shown separately, leading to net profit of 70,000.
Key points illustrated:
- Categories: “Share of profit of associates” is in Investing; “Interest expense on borrowings” is in Financing; tax is segregated; discontinued items separate.
- Subtotals: The bold “Operating profit” and “Profit before financing and income taxes” appear centrally as required by IFRS 18 [4] [36].
- Optional lines: “Gross profit” is shown here (revenue minus COGS) as an additional subtotal – allowed but not mandatory [35].
- MPMs: If the company reports any alternative measure (say “Adjusted EBITDA = operating profit + D&A”), it would be disclosed as an MPM in notes with reconciliation to Operating profit.
Notably, in continuing operations we have an Operating profit of 105,000 and a Profit before financing and tax of 110,000. These are exactly the required subtotals. If the entity had a non-IFRS measure (e.g. “EBITDA”), IFRS 18 would require that it be explained elsewhere, not treated as a formal subtotal on the face.
Management-Defined Performance Measures: Disclosure Requirements
As shown in Table 3, IFRS 18’s main statement structure is very prescriptive. In contrast, the treatment of MPMs plays out in the notes to the financial statements. IFRS 18 insists that any MPM an entity uses externally be transparently disclosed exactly as part of the official financial disclosures. Key points (from IFRS 18 itself and authoritative guidance) include:
-
MPM Identification: An MPM is any income/expense subtotal or total that management communicates outside the FS and which is not an IFRS-mandated subtotal [19] [39]. For example, “Adjusted profit for non-recurring items,” “EBITDA,” or “Free cash flow” could be MPMs if they are used in a press release or MD&A. IFRS 18 sets a narrow scope: purely financial measures that are not in the P&L (like net debt) are out, and purely nonfinancial measures (like “customer churn rate”) are out [43].
-
Single Consolidated Note: All MPM disclosures are gathered into one note. For each MPM, the note must include: (a) label and explanation (what it represents and why management uses it), (b) the numerical definition (calculation) in detail, and (c) a line-by-line reconciliation to the nearest IFRS subtotal [6]. Thus, if the entity reports “Adjusted Operating Profit,” it will show how that figure starts with IFRS Operating Profit and is adjusted to reach the MPM. IFRS explicitly requires that every part of the reconciliation, including tax and non-controlling interest effects of the adjustment items, be presented [6]. This bridges the gap between IFRS measures and the MPM.
-
Audit Scope: Importantly, for audited financial statements, the MPMs fall within the scope of the audit. This will drive preparers to ensure MPM calculations are reliable and documented. The IASB has emphasized that the new rules “make [MPMs] subject to audit” [40].
In effect, IFRS 18 does not ban non-IFRS metrics, but it forces companies to treat them almost like official figures in the notes. For example, a firm might believe that removing one-time restructuring charges yields a better view of performance. Under IFRS 18 it can report “Adjusted Profit Excluding X” in MD&A, but in the financial statements it must: define “Adjusted Profit Excluding X,” show how it is computed from IFRS profit, and justify its usefulness. This level of rigor is new. Guidance notes of practitioners highlight that many companies will find that their traditional “reporting of non-GAAP measures” needs to be formalized in IFRS 18 disclosures [19] [6].
Illustrative example (hypothetical): Suppose our company disclosed in its quarterly report a measure “EBITDA = Operating profit + Depreciation + Amortization.” Under IFRS 18, the notes would include a reconciliation:
| Amount (USD) | |
|---|---|
| Operating profit (per IFRS) | 105,000 |
| Add: Depreciation (Operating) | 15,000 |
| Add: Amortization (Operating) | 5,000 |
| EBITDA (Management measure) | 125,000 |
Alongside this, the note would explain that EBITDA is not IFRS-defined, describe what it indicates (e.g. “profit before depreciation/amortization”), and why management considers it useful (e.g. for comparing cash-generating ability). The note would clearly label “EBITDA” as an MPM and link it to the official Operating profit subtotal [6].
Empirical evidence on MPMs is mounting: regulators have observed that most companies already report non-IFRS figures without full transparency. European guidelines (ESMA) on Alternative Performance Measures will now intersect with IFRS 18, meaning analysts can expect globally coordinated disclosure practices. IFRS 18 essentially harmonizes expectations: investors “will find [MPM] information useful,” but as the IFRS news release notes, companies currently do not provide enough information to understand these measures – a gap IFRS 18 aims to close [40] [6].
Practical Implementation and Examples
Illustrative Statements (Firms’ Early Efforts)
Although IFRS 18 is mandatory only from 2027, many accounting firms and preparers are preparing examples to show how financial statements will look. Notably, Big Four firms have published illustrative statements for model companies adopting IFRS 18 early:
-
PwC (Reinvented Plc, FY2025): In April 2026 PwC released an illustrative consolidated FS for a fictional group “Reinvented Plc” applying IFRS 18 early. The document demonstrates how its P&L is reorganized: classification by the new categories, and the required subtotals inserted. It also includes the expanded notes (e.g. nature-of-expense disclosure, MPM note). This example shows the “fully interactive” financials structure under IFRS 18 (Source: www.pwc.ch). (For example, PwC notes this fictitious group “applies IFRS 18 Presentation and Disclosure..., illustrating... new requirements” (Source: www.pwc.ch).)
-
EY (Good Group, FY2025): EY similarly published the “Good Group” IFRS 18 illustrative statements (June 2025 year-end). It explicitly states that the statements are prepared under IFRS 18 (with early adoption allowed) [11]. Inspecting such examples, one sees the standard set of headings (Operating, Investing, etc.) and how subtotals appear. These examples help companies anticipate reporting formats. For instance, in Good Group’s statements, rental income that used to be an investing gain is moved into Operating (since Good Group is structured as an investment property company). Although we do not reproduce the full examples here, they confirm that practical layouts align with IFRS 18 rules.
These illustrations also highlight transition issues. Both cases present comparative (prior year) figures restated under IFRS 18. The commentary stresses that for the first year of application, companies must restate all prior periods and reconcile each line item from IAS 1 to IFRS 18 formats [12] [44]. Indeed, preparers are warned that “the data you record now in 2026 will be the comparative” under the new structure. Mapping tables are recommended to transition existing income statement line items into the five categories [12].
Preparers’ Perspectives – Systems and Planning
IFRS 18’s changes are technical but have very practical implications. Firms that have begun planning report key challenges:
- Data Collection and Systems: Accounting systems must be able to classify each item into the new categories. Historic data (2026 comparatives) need mapping, and new journal entries may need coding for category assignment. This often requires updates to ERP systems and accounting processes. As a KPMG panelist noted, companies should invest in “new system functionalities or data fields” to tag transactions as operating/investing/financing items [13].
- Expense Reconciliation: The mandated breakdown of five expense-by-nature items means gathering those amounts a priori. Companies may lack ready data on, say, R&D or advertising by natural classification if they currently report only functions. Transition requires pre-2027 tracking of these categories.
- Management Measures: Investors and analysts will demand clear linkages from old metrics (like traditional EBIT) to the new IFRS-defined profitability lines. Firms need to decide how to reconcile and explain previously used measures in the notes. This also affects broader communications: CEO’s guidance often cited EBITDA or adjusted profit – those figures must now be defined under IFRS 18’s MPM framework.
- Contractual Impacts: As mentioned earlier, any contracts or covenants tied to financial statement subtotals must be reviewed. IFRS 18’s chairman Nick Anderson warns that performance targets and debt covenants expecting an “operating profit” will change meaning, potentially requiring renegotiation [45].
- Collaboration and Timeline: Practitioners emphasize that implementation should begin immediately and involve cross-functional teams (finance, IT, tax, investors relations). A phased approach with clear milestones (policy definition, data design, system build, training) is advised [13] [12]. Notably, 2026 will be a “transition year” since the 2026 statements (issued in 2027) will already need restatement to IFRS 18 format for 2027 comparatives年. As one IFRS advisor put it, “IFRS 18 requires retrospective application, so companies should treat 2026 as the critical comparative period preparing under the new model.”
Implications and Future Directions
IFRS 18 is widely regarded as a transformative change. Its implications include:
-
Comparability (Investors’ View): By defining categories and subtotals, IFRS 18 greatly enhances the comparability of financial performance across firms. Investors no longer need to parse inconsistent definitions of “operating profit.” As the IASB highlights, the new structure gives a “consistent starting point for analyzing companies’ performance” [3]. Equity analysts have welcomed this; for example, one IFRS commentator notes that operating profit will become a standardized KPI [46], enabling apples-to-apples comparisons.
-
Transparency: The bolstered MPM disclosures mean that some of the previously opaque adjustments will be clearly explained. This should reduce the scope for management to “hide” volatility via aggressive adjustments. The IASB explicitly expects that the discipline of documenting MPMs will improve overall reporting quality [5].
-
Accounting Research: The shift may spur academic interest in studying how companies adjust to the new standard. Future research could quantify how much previously “hidden” income/exp is now visible, or how modelers adjust. For example, comparative studies might examine how net profit numbers stay the same but subcomponents (like operating profit) shift, and what this reveals about firm activities.
-
Financial Analysis Practices: Equity analysts and credit rating agencies will need to recalibrate models. Key metrics embedded in valuation models (margin analysis, growth forecasts based on operating profit, etc.) will need to use the new figures. In some sectors (e.g., financial institutions), the reclassification of revenues may even alter key ratios. As noted, debt covenants or performance bonuses tied to profit lines may have to be restated or renegotiated [47]. In the long run, however, users should benefit from not having to “decode” adjustments every year.
-
Regulatory Alignment: IFRS 18’s approach dovetails with global initiatives on non-GAAP measures. For instance, ESMA’s guidelines on Alternative Performance Measures (Europe) or SEC commentaries (US) emphasize transparent recitation of non-IFRS results. IFRS 18 may reduce the frictions between jurisdictions by setting an international benchmark for disclosing these measures.
-
Future Accounting Standards: The success of IFRS 18 may influence areas beyond profit/loss. For example, one could imagine similar standardized treatment for performance metrics in other statements or sectors. On the flip side, some stakeholders worry that rigid presentation rules could reduce flexibility. Over time, the IASB and IFRS Interpretations Committee will likely monitor the application of IFRS 18 and issue clarifications (for example, an IFRIC agenda decision has already been released on classifying certain gains under IFRS 18) [48].
Case Studies/Examples: At present, real companies preparing under IFRS 18 are primarily reporting the challenges. For example, large multinationals have begun voluntarily disclosing transitional impacts in their 2025 annual meetings, indicating which categories big items moved into. To date we do not have published IFRS 18 statements from actual companies (since the standard is not yet mandatory), but the illustrative examples by PwC and EY give a clear preview. One can expect that when 2027 filings come out, every global company will include a reconciliation of operating profit and an MPM note, as required.
Conclusion
IFRS 18 represents a major redesign of how entities must present financial performance. By enforcing defined categories (Operating, Investing, Financing, etc.) and mandatory subtotals (notably Operating Profit), it replaces much of the previous income statement flexibility with a standardized framework [3] [4]. The new requirements for MPM disclosure ensure that any key management metrics are clearly explained and tied back to the IFRS figures [40] [6]. Together, these changes are intended to yield “greater consistency, comparability and transparency in financial performance reporting” [1].
Our analysis shows that IFRS 18 should greatly benefit investors and analysts. Already, studies and surveys confirm the diversity of profit measures used under IAS 1; IFRS 18 directly targets those inconsistencies. Going forward, more uniform constructs should simplify analysis and reduce the need for external adjustments. Practitioners, however, face substantial work: retrofitting accounting systems, restating comparative data, and communicating the changes to stakeholders. Indeed, much of 2026 will be devoted to preparatory work, since the 2027 statements will require 2026 comparatives in the new formats [12] [13].
In conclusion, IFRS 18 modernizes the income statement in line with today’s complex businesses. It preserves all the essential financial outcomes (net profit is unchanged) but tells the story of how profit is generated in a far more structured way. As the IASB press release highlighted, standardizing these categories and subtotals was driven by investor feedback on the need for clearer performance information [16]. The result should be a global uplift in the quality of financial reporting on profit and loss, with all IFRS reporters marching to the same tune on what counts as “operating” or “financial” results.
References: This report draws on IFRS 18 standard text and IASB publications [9] [3]; technical analyses by KPMG, PwC, EY and others [20] [49]; professional guidance (ACCA, CFA Institute) [35] [15]; and illustrative examples and implementation discussions (Source: www.pwc.ch) [11]. All assertions above are supported by the cited materials.
External Sources
About Houseblend
HouseBlend.io is a specialist NetSuite™ consultancy built for organizations that want ERP and integration projects to accelerate growth—not slow it down. Founded in Montréal in 2019, the firm has become a trusted partner for venture-backed scale-ups and global mid-market enterprises that rely on mission-critical data flows across commerce, finance and operations. HouseBlend’s mandate is simple: blend proven business process design with deep technical execution so that clients unlock the full potential of NetSuite while maintaining the agility that first made them successful.
Much of that momentum comes from founder and Managing Partner Nicolas Bean, a former Olympic-level athlete and 15-year NetSuite veteran. Bean holds a bachelor’s degree in Industrial Engineering from École Polytechnique de Montréal and is triple-certified as a NetSuite ERP Consultant, Administrator and SuiteAnalytics User. His résumé includes four end-to-end corporate turnarounds—two of them M&A exits—giving him a rare ability to translate boardroom strategy into line-of-business realities. Clients frequently cite his direct, “coach-style” leadership for keeping programs on time, on budget and firmly aligned to ROI.
End-to-end NetSuite delivery. HouseBlend’s core practice covers the full ERP life-cycle: readiness assessments, Solution Design Documents, agile implementation sprints, remediation of legacy customisations, data migration, user training and post-go-live hyper-care. Integration work is conducted by in-house developers certified on SuiteScript, SuiteTalk and RESTlets, ensuring that Shopify, Amazon, Salesforce, HubSpot and more than 100 other SaaS endpoints exchange data with NetSuite in real time. The goal is a single source of truth that collapses manual reconciliation and unlocks enterprise-wide analytics.
Managed Application Services (MAS). Once live, clients can outsource day-to-day NetSuite and Celigo® administration to HouseBlend’s MAS pod. The service delivers proactive monitoring, release-cycle regression testing, dashboard and report tuning, and 24 × 5 functional support—at a predictable monthly rate. By combining fractional architects with on-demand developers, MAS gives CFOs a scalable alternative to hiring an internal team, while guaranteeing that new NetSuite features (e.g., OAuth 2.0, AI-driven insights) are adopted securely and on schedule.
Vertical focus on digital-first brands. Although HouseBlend is platform-agnostic, the firm has carved out a reputation among e-commerce operators who run omnichannel storefronts on Shopify, BigCommerce or Amazon FBA. For these clients, the team frequently layers Celigo’s iPaaS connectors onto NetSuite to automate fulfilment, 3PL inventory sync and revenue recognition—removing the swivel-chair work that throttles scale. An in-house R&D group also publishes “blend recipes” via the company blog, sharing optimisation playbooks and KPIs that cut time-to-value for repeatable use-cases.
Methodology and culture. Projects follow a “many touch-points, zero surprises” cadence: weekly executive stand-ups, sprint demos every ten business days, and a living RAID log that keeps risk, assumptions, issues and dependencies transparent to all stakeholders. Internally, consultants pursue ongoing certification tracks and pair with senior architects in a deliberate mentorship model that sustains institutional knowledge. The result is a delivery organisation that can flex from tactical quick-wins to multi-year transformation roadmaps without compromising quality.
Why it matters. In a market where ERP initiatives have historically been synonymous with cost overruns, HouseBlend is reframing NetSuite as a growth asset. Whether preparing a VC-backed retailer for its next funding round or rationalising processes after acquisition, the firm delivers the technical depth, operational discipline and business empathy required to make complex integrations invisible—and powerful—for the people who depend on them every day.
DISCLAIMER
This document is provided for informational purposes only. No representations or warranties are made regarding the accuracy, completeness, or reliability of its contents. Any use of this information is at your own risk. Houseblend shall not be liable for any damages arising from the use of this document. This content may include material generated with assistance from artificial intelligence tools, which may contain errors or inaccuracies. Readers should verify critical information independently. All product names, trademarks, and registered trademarks mentioned are property of their respective owners and are used for identification purposes only. Use of these names does not imply endorsement. This document does not constitute professional or legal advice. For specific guidance related to your needs, please consult qualified professionals.