NetSuite SuiteAnalytics Workbook Guide: Datasets & Pivots
Executive Summary
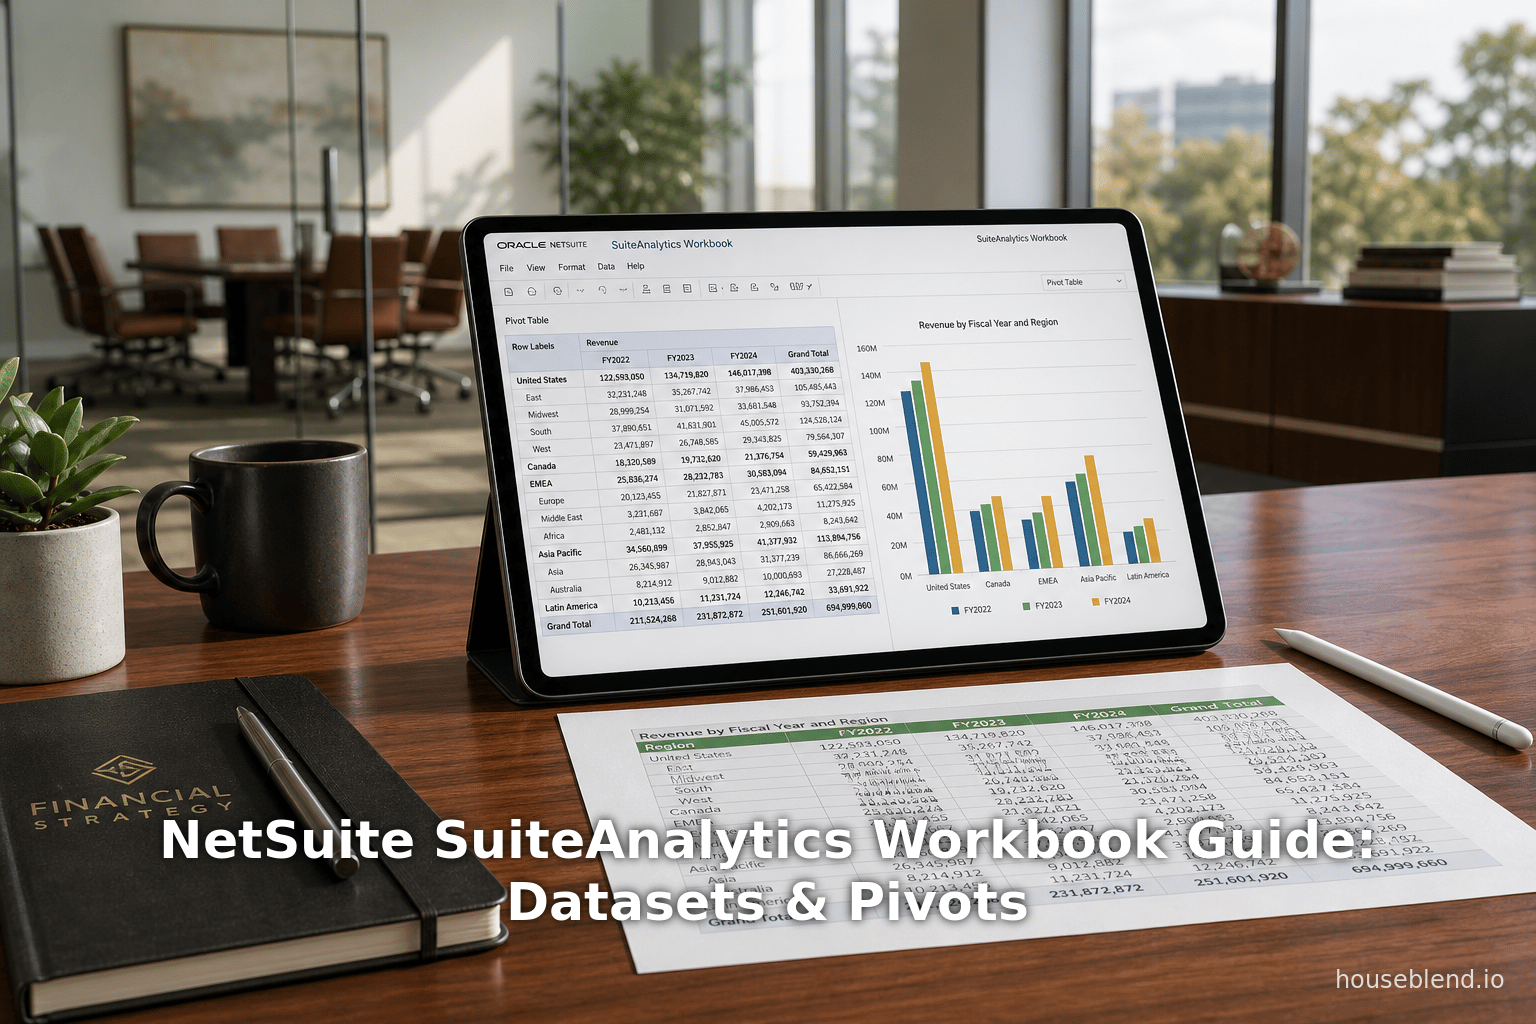
SuiteAnalytics Workbook is NetSuite’s modern, self-service analytics solution that unifies data querying, pivot-table exploration, and visual charting within the ERP. Introduced in the 2019.1 release, Workbook enables business users to construct custom datasets (queries), summarize data via drag-and-drop pivot tables, and create charts without any external tools or coding [1] [2]. Unlike traditional Saved Searches or separate reporting tools, Workbook leverages NetSuite’s new analytics data source to provide a consistent, SQL-based view of live ERP data [3] [2]. This research report provides an exhaustive guide to SuiteAnalytics Workbook, covering its historical development, core components, use cases, and future directions, with detailed evidence and references. Key points include:
-
Datasets – the Foundation: A Dataset is a user-defined query of one or more record types, with fields, filters, and joins. Each Workbook is based on one or more Datasets. The Dataset Builder allows multiple record types to be joined (via left-joins) in a single query [4] [5]. Users can drag fields into the dataset, apply filter criteria (akin to Saved Search conditions), and even define formula fields [6] [7]. Datasets can be saved, shared, and reused in multiple Workbooks [8] (Source: www.anchorgroup.tech), promoting consistency. Beginning in the 2024.1 release, NetSuite also lets users export the underlying SuiteQL (SQL) query of a Dataset to a text file for transparency and external analysis (Source: timdietrich.me) [9].
-
Pivot Tables and Charts: The pivot engine is where Workbook “truly shines” [10]. Users add a Pivot to a Workbook and then drag-and-drop fields into Row, Column, Measures, and Filters zones to slice and aggregate data [11] [12]. Numeric fields become default measures (sum, count, etc.), and users can create calculated measures via the UI [13]. Hierarchical fields (e.g. Category→Subcategory) automatically generate expandable subtotals [14]. Pivot tables support rich formatting – grand totals, sorting, conditional formatting, and more – and multiple pivots can exist in one Workbook, functioning like separate spreadsheet tabs. Workbook charts are directly tied to pivots: adding a Chart uses the selected pivot’s data, and users can easily adjust axes, series, and chart types [15] [16]. Workbooks greatly extend what Saved Searches can do, enabling multi-dimensional analysis and visual dashboards with multiple pivots and charts in one report [15] [17].
-
Excel and Data Export: All Workbook views can be exported on demand. The Export icon offers CSV, Excel, and PDF outputs [18]. Exporting raw data (CSV) yields the full dataset query results for use in other tools. Exporting to Excel produces a spreadsheet that preserves the pivot structure (multi-level rows/columns) [18], rather than just raw rows. PDF exports produce a print-ready snapshot of the current view. Additionally, starting in 2024.1 users with AnalyticsAdmin access can export a Dataset’s join definitions as a SuiteQL text file [9], which assists in understanding or replicating the query logic externally. These export capabilities remove previous needs to “switch to Excel” for analysis, enabling distribution of workbook results without manual data wrangling [19] [18].
-
Comparisons and Perspectives: In comparison with traditional NetSuite tools, SuiteAnalytics Workbook represents a paradigm shift. Saved Searches remain useful for simple list reports and rapid queries, but Workbook is better for cross-module queries, pattern discovery, and reporting on complex data sets [15] [20]. For example, Saved Searches excel at text-based or summary lists, whereas Workbooks deliver interactive dashboards and charts natively [20]. A key industry context is that many companies still rely heavily on spreadsheets for analysis – studies show only ~29% of employees use BI tools at all [21] and 58% of finance leaders rely on Excel for automation [22]. By embedding powerful analytics within NetSuite, Workbook aims to narrow this gap and let business users “gain a better understanding of the details behind their data” without leaving the ERP [23] [24].
-
Use Cases and Examples: SuiteAnalytics Workbook is used for a wide variety of reports: sales performance dashboards, financial trend analysis, inventory aging, marketing ROI, etc.For instance, a NetSuite administrator can join Sales Order and Item records in a Dataset, then create a pivot breaking down revenue by Customer Category and Month [25]. Another scenario is analyzing marketing campaigns: an author example used a Dataset starting from the Campaign record to measure campaign ROI across related transactions (Source: www.anchorgroup.tech). Because any field from any record can be queried, Workbooks handle scenarios previously impossible or very difficult with Saved Searches. Many NetSuite partners report that customers use Workbooks for strategic dashboards (KPIs, P&L, project analysis) that update in real time, eliminating hours of Excel manipulation. These real-world examples illustrate that multiple departments (Finance, Sales, Inventory, Projects, etc.) can leverage Workbooks to gain insights.
-
Performance and Best Practices: Working with large datasets requires careful design. NetSuite documentation and experts recommend limiting the dataset with filters (e.g. date ranges) and performing joins judiciously [26] [27]. Since datasets return raw data (no aggregation by default) [28], adding many joined record types can balloon result-set sizes. Best practices include indexing key fields, minimizing number of rows in source records, and avoiding high-cardinality fields in both rows and columns of a pivot [26] . NetSuite has built-in optimizations: a query cache holds workbook results up to 60 minutes [29], and an “Optimized Data Refresh” mode can serve pivot data from the cache (stale by at most an hour) to speed reports [29]. Workbooks should be tested and refined for performance, much like any database query.
-
Future Directions and Implications: SuiteAnalytics Workbook continues to evolve. NetSuite has added features each release (standard dataset templates, numeric formatting, UI enhancements [30]), and more are expected as customer demand grows. Integration with other BI tools is also possible: NetSuite’s SuiteAnalytics Connect provides ODBC/SuiteQL access to the same data model for users needing advanced modeling in tools like Power BI or Tableau [31]. Looking forward, we anticipate further automation (scheduling, alerts, AI-driven insights) and deeper embedding of analytics. As Self-Service BI matures, SuiteAnalytics Workbook positions NetSuite customers to leverage real-time, governed insights directly in their ERP – a strategic advantage as data-driven decision-making becomes ever more central to business success [21] [32].
The remainder of this report delves deeply into each of these aspects: the architecture and features of Datasets; the mechanics and capabilities of Pivot Tables (including calculated measures, filters, and formatting); the process of exporting data and pivot views (CSV, Excel, PDF, SuiteQL); comparisons with Saved Searches and third-party analytics; practical use cases; and future outlook. All claims are supported by official documentation, expert blogs, and case examples to ensure a comprehensive, evidence-based treatment of NetSuite’s SuiteAnalytics Workbook.
Introduction and Background
Modern enterprises generate massive volumes of data across sales, finance, inventory, and operations. Making sense of this data in real time is critical for agile decision-making, but historically has been challenging within ERP systems. NetSuite (now Oracle NetSuite) has long provided Saved Searches and static reports for querying data, but users often resorted to exporting to Excel for deeper analysis (e.g. pivot tables) [19] [24]. Industry research highlights this gap: even as analytics tools advance, only about 29% of employees use business intelligence (BI) tools on a given day [21], and many finance professionals still “cling to spreadsheets” for their analysis needs [22]. (A 2024 survey by Rossum found 58% of finance leaders rely on Excel as their primary automation tool [22].) This reliance on ad hoc spreadsheets leads to wasted time (one study found workers spend roughly 30% of their time just finding and combining data) and risks from unmanaged data copies [33] [22].
In response to these challenges, NetSuite unveiled the SuiteAnalytics Workbook feature in the 2019.1 release [1] (Source: mysuite.tech). Workbook was designed as an in-ERP, self-service analytics environment, intended to eliminate the round-trip to Excel by providing pivot-like summarization and visualization natively. As one solutions consultant explains, Workbook “combines the abilities of a report, saved search, and Microsoft Excel all in one” [24]. At launch, Workbook became the third component of NetSuite’s analytics portfolio (joining Saved Searches and SuiteAnalytics Connect). It leveraged a new unified analytics data source introduced at that time [3], which exposes a consistent SQL-based view of all record types. This means that fields have uniform naming and behavior whether accessed via Workbook, standard reports, or SuiteAnalytics Connect – avoiding the inconsistencies of legacy Saved Search queries.
SuiteAnalytics Workbook is aimed at a broad audience. Business users (finance, sales, marketing managers) can use its drag-and-drop UI without knowing code or SQL [1] [34]. The learning curve is modest for NetSuite-savvy users: the interface feels like an enhanced Saved Search or like an Excel pivot window in the browser. Meanwhile, IT and data professionals benefit from its structured design: data joins are defined formally (no hidden backend links), and datasets can be exported as SuiteQL to prototype or embed in integrations (Source: timdietrich.me) [9]. Importantly, Workbooks operate on live ERP data. When criteria change, the preview and pivots refresh in real time, reflecting current financials and transactions [8] [18].
Technically, a SuiteAnalytics Workbook comprises three layers [2]:
- Datasets – The foundation queries that specify which records, fields, filters, and joins supply the data. Each Workbook is built atop one or more Datasets.
- Pivot Tables – Multi-dimensional summary tables that cross-tabulate and aggregate the dataset results. Pivot tables in Workbooks are analogous to Excel pivots: users select row and column categories, and define measures (sums, counts, averages) to populate the grid.
- Charts – Graphical visualizations (bar, line, pie, etc.) derived from pivot tables or tables. Charts dynamically reflect the pivot’s data and update as the pivot is filtered or refreshed.
These components mirror a typical analysis pipeline: first extract the raw data (Dataset), then summarize it (Pivot), then visualize it (Chart). With this architecture, Workbook replaces many common BI tasks. For example, it can replicate and extend reports that were previously only possible via combination of Saved Search and external pivot. NetSuite’s own help calls Workbook an “analytical tool” that “fully customize[s] workbooks that combine datasets, tables, pivot tables, and charts using a single tool” [35]. Indeed, SuiteAnalytics Workbook is marketed as an answer to “the growing need for self-service business intelligence directly inside NetSuite” [36].
For context, it is useful to compare Workbooks to Saved Searches. Saved Searches remain extremely versatile: they support formula columns (SQL snippets), email alerts, and scriptability. However, Workbook has capabilities beyond Saved Searches: drag-and-drop pivot creation, built-in charting, conditional formatting, and multi-dataset dashboards [15] [32]. The short characterization offered by a prominent blog is apt: “Use Saved Searches for quick lists, formula-driven columns, and scripting. Use Workbook for multi-dimensional analysis, pivot tables, and visual dashboards” [37]. Workbooks also produce items that can be added to dashboards (portlets) and scheduled, just as Saved Searches can. (In fact, the Workbook Pivot Tables help guide notes that pivots can be added to any dashboard portlet [38].)
Historically, SuiteAnalytics Workbook has evolved rapidly. In the initial 2019.1 (beta), it proved its concept of integrated analytics. By 2019.2 (General Availability) NetSuite shipped enhancements such as built-in templates (e.g. a standard Transaction Detail workbook), SuitePeople analytics (time-off, tax jurisdiction reports), an improved dataset builder UI, and enhanced formula support [30]. Throughout 2020–2023 NetSuite and partners continued releasing more dataset and workbook improvements. Today (2026) SuiteAnalytics Workbook is an advanced, production feature in use by many organizations, and its development continues as part of NetSuite’s analytics strategy.
This paper will now examine in detail the key aspects of SuiteAnalytics Workbook. We begin with Datasets, describing how users build and manage the data queries. We then analyze Pivot Tables and Charts, giving step-by-step operation and capabilities. Next we explain Data Export and Excel interoperability, including CSV/Excel/PDF and SuiteQL outputs. Each of these core sections will include technical details, usage scenarios, and best practices (with references). We will also intersperse perspectives on how different stakeholders use the feature, and how it compares to alternatives. Case examples and statistics will illustrate real-world impact. Finally, we discuss current implications and future directions – how SuiteAnalytics Workbook fits into the broader analytics landscape and where it is headed. Citations from product documentation, expert blogs, and research reports are provided throughout to substantiate all claims.
SuiteAnalytics Workbook Datasets
Definition and Role of Datasets
In SuiteAnalytics Workbook, a Dataset is the data source or “query builder” that defines what information is available for analysis. Think of a Dataset as the analog of a Saved Search’s Criteria and Results columns, but far more powerful in structure. Each dataset specifies:
- Primary Record Type: The main NetSuite record being queried (e.g. Sales Order, Customer, Item). Every dataset is built on one primary record.
- Additional Joins: Optional secondary record types that link to the primary record. For example, a Transaction dataset can join to Customer or Item records, or a Project dataset can join to Department. Importantly, joins in Workbooks support multiple levels of chaining (e.g. Transaction → Customer → Sales Rep → Department) [27], overcoming limits of one-level joins in Saved Searches.
- Fields (Columns): The specific fields from the primary and joined records to include in the query (e.g. Order Date, Amount, Customer Name, Item Category). Users drag fields into the dataset schema to define the output table columns.
- Criteria (Filters): The filter conditions that restrict which records are returned (e.g. Date within last fiscal year, Type = Invoice, Department = “Sales”) [7]. These can be grouped and combined with AND/OR logic. Like Saved Search criteria, the dataset canvas lets users add multiple filter lines and group them for complex logic [7].
Once saved, the dataset acts like a reusable query. Multiple workbooks (and multiple tabs) can connect to the same dataset concurrently [39]. This separation of data definition (dataset) from data layout (workbook) is a key innovation of Workbook. For example, an organization could build a “Sales Orders” dataset with all relevant fields and filters, then create several different workbook tabs (or separate workbooks) for different pivot tables and charts on those sales orders. If later the data criteria need updating, only the dataset needs refreshing, and all linked workbooks will reflect it.
NetSuite provides some pre-built standard datasets out of the box (e.g. Customers, Transactions, Inventory) which can be copied and customized. In addition, administrators can create custom datasets. When creating a new dataset, users are presented with a list of record types; selecting one initializes a default view (much like a raw Saved Search). From there, the interface behaves similarly to a Saved Search Results page, but live-updating: users drag columns into the table and immediately see the preview of results [6] [40]. All changes (adding/removing columns, changing filters) refresh the data preview without needing to explicitly “save” each time [6] [40].
Building a Dataset
To create a new dataset, one navigates to Analytics > Datasets > New Dataset in NetSuite. The steps typically are: select the primary record type, then the Dataset Builder opens (on the Data tab) with a blank layout of columns and filters [6] [41]. The left pane (“Dataset Panel”) shows available fields (grouped by record and type). Users drag fields from the panel into the center table preview grid to include them as output columns. Fields can be from the primary record or any joined records. By default, when multiple record types are added, the system inserts left-outer-joins behind the scenes [27] (Source: timdietrich.me). In practice this means all rows of the primary record are included, with matching data from secondary records when they exist [28].
Filtering works by dragging fields into a designated Conditions area (often at the top of the Data tab) or by clicking “Add Condition” [7]. A common example is filtering a Sales Orders dataset to include only Orders in the current fiscal year, or only Orders with Status = Pending Approval. As in Saved Searches, each filter row has a field, a comparator (is, is not, on or before, etc.), and a value. Conditions can be nested with AND/OR group operators [7]. The visual builder in the dataset makes adding or modifying filters quicker than Saved Search: changes appear immediately in the preview [40], whereas Saved Searches required saving and rerunning to see changes.
Datasets also support formula fields. Within the dataset builder, users can create a new formula (via “Formulas > New Formula”). This opens a dialog where a name and data type are defined, and the formula is entered (often using simple operators or references to other fields). Formulas can perform calculations, concatenations, date operations, etc. Before saving, the formula can be validated for type errors [42]. Once saved, custom formulas appear in the field list in the left panel and can be dragged into criteria or output columns just like any other field [42]. This capability is analogous to formula (SQL) columns in Saved Searches, but here it is integrated with the dataset UI.
For example, to analyze sales performance, an administrator might create a Sales Order dataset, then join it to Item and Customer records. They might add columns Sales Order: Date, Sales Order: Amount, Item: Category, Customer: Region, etc. They could filter the dataset to only include the current fiscal year or only orders in certain countries. If needed, they could add a formula field like SalesOrderAmountUSD = {amount} * {currency.rate} (to standardize currency) within the dataset. Once defined and saved (giving it a descriptive name, which is recommended [43]), this dataset can be the source for one or more pivot analyses.
Best practices: NetSuite recommends applying limiting filters within the dataset whenever possible, rather than after the fact in a pivot or workbook. For large tables of data, trimming by date range or status reduces the amount of data processed. Also, because all joins in the dataset produce raw rows, avoid including too many high-cardinality joins if not needed [26] [28]. It is better to narrow early. Unlike Saved Searches, you do not have to “save & run” repeatedly; the dataset shows live results as you configure it [42] [40]. Finally, always give each dataset a clear name and description upon saving [43], because it will be referenced by future workbook builders.
Linking and Multi-Dataset Analysis
A powerful aspect of SuiteAnalytics datasets is the ability to query multiple modules together. Whereas traditional reports often had to be run separately for each record type, Workbooks can combine data. For instance, a single dataset might pull fields from Projects, Customers, and Items simultaneously, enabling cross-module reporting. This is achieved through Dataset Links. On the Pivot tab (when building a pivot), one can click “Create Dataset Link” to join two datasets by a common key [44]. This advanced feature allows pivot tables that aggregate data across fundamentally different datasets (like linking financials to CRM leads, if a common key exists).
Under the hood, every dataset itself can include multiple joins. Houseblend’s performance guide notes that “when you add multiple record types to a dataset, the system executes SQL-style joins (specifically, left outer joins for each additional record type)” [4]. In practice, most users create dataset joins by adding related fields (dragging them in prompts the join). The result is an internally generated SQL query. NetSuite even makes this SQL visible: as of 2024.1, clicking “Export > Export to SuiteQL TXT” downloads a .txt file containing the SQL query behind the dataset (Source: timdietrich.me). This can help explain how fields are joined or tune performance (e.g. seeing indexes being used). However, note that datasets return raw detail rows by default, without automatic rollups. Aggregations occur later in pivots or charts.
In summary, SuiteAnalytics Datasets provide a flexible, guided query layer that goes far beyond Saved Searches. They allow multi-level joins, immediate result preview, formula fields, and can be shared or linked across workbooks. They are the crucial first step: the raw data canvas upon which all subsequent pivots and charts are built.
Pivot Tables (and Charts)
Creating and Configuring a Pivot Table
Once a dataset is ready (i.e. the desired fields and filters have been defined), users switch to the Pivot tab in the Workbook to summarize the data. Creating a pivot table is straightforward: click Add Pivot, which generates a blank pivot canvas [45]. The Pivot Editor displays four drop zones: Rows, Columns, Measures, and Filters [46] [47]. Users drag fields from the Dataset panel into these zones:
- Rows: Fields placed here become the row categories of the pivot. Each unique combination in the row fields creates a hierarchy of rows. You can drop multiple fields to create nested rows (e.g. Category then Name) [12]. Each row field in effect groups the data vertically.
- Columns: Fields placed here become the column headers. A common use is a date field (grouped by month or quarter) or a dimension to compare side-by-side (e.g. year, region). The combination of Row fields and Column fields creates a cross-tabulation.
- Measures: Fields (usually numeric) placed in the Measures zone determine the cell values. By default numeric fields are summed. Clicking on a measure allows changing the summary type (Sum, Average, Count, Min, Max, etc.) [48]. Non-numeric fields can also be put in Measures for counts or other aggregations. Workbooks can have multiple measures in one pivot, each generating a separate data column. Each measure can optionally be converted into a calculated measure (see below).
- Filters: Fields placed in Filters (Pivot Filters) restrict which subset of data appears in that particular pivot table without altering the underlying dataset. For example, you might have a global date filter in the dataset, and then add a Category field as a pivot filter to quickly toggle which categories to include in the pivot view. Pivot filters are also drag-and-drop and can be changed on the fly.
As an example, imagine a Sales dataset with fields Customer Category, Date (set to Month), and Amount. Dragging Customer Category to Rows and Date (Month) to Columns creates a matrix whose rows are customer segments and columns are months. Then dragging Amount to Measures will populate each cell with the sum of sales for that category and month [12]. The pivot table appears on screen immediately (clicking the Refresh button if needed) with expandable row sections. At each subtotal level, a drop-down icon lets the user expand or collapse the hierarchy [12].
The Layout Panel (where Rows/Columns/Measures appear) also allows formatting. For dates and numbers, the panel has options to change summary type and format (right-click a field and choose “Format…”) [48]. For currencies, one can enable currency conversion (to consolidate multi-currency values) [48]. Totals and grand totals can be toggled on/off via the Totaling icon [49]. All these changes take effect on refresh.
Calculated Measures and Sorting
An important feature of Workbook pivots is the ability to create calculated measures without writing formulas. A calculated measure is a new numeric field derived from other fields. For example, if you have Quantity and Price, you could create Revenue = Quantity × Price as a calculated measure. To do this, click Create Calculated Measure in the pivot Layout Panel or use the field menu next to an existing measure [13]. A dialog appears to enter the formula (using the same fields as in the dataset). Once saved, the new measure icon appears with a calculator symbol. It then behaves like any other aggregated field in the pivot [13]. Behind the scenes, the workbook automatically includes any necessary join or detail for that formula to compute, all in the background. This is the pivot equivalent of Saved Search formula columns, but more approachable via point-and-click.
Pivots also allow sorting and ranking. Any measure column in the pivot output can be clicked to sort by that value (ascending or descending). Additionally, right-clicking a measure and selecting “Rank” adds a computed rank column (1, 2, 3, …) for that measure [50]. These features let users quickly identify top or bottom segments (e.g. top 10 customers by sales). Conditional formatting rules can also be applied by right-clicking a measure header (gradients, thresholds) to highlight patterns [16].
Filters and Drill-Down
Each pivot table can have filters independent of the dataset. Fields in the Pivot Filters zone (or the “Add it as filter” area) limit which rows appear. For example, in the pivot above you could drag Sales Rep into Filters and select only certain reps. Filters can also be created on the pivot itself without being in the dataset (by dragging a field’s filter icon from the Dataset panel straight into Pivot Filters). This versatility means you can query broadly in the dataset, then drill into specifics in each pivot view. The Table (Data) tab and Pivot tab share the same dataset, so adding a pivot filter does not remove the data source – it only masks it for that table view.
Importantly, pivots in workbook are dynamic and interactive. If the underlying dataset changes (for example, if a date filter in the Data tab is adjusted), all pivots must be manually refreshed (click Refresh) to update. Any change to the pivot layout (moving a field, adding a measure) also requires clicking Refresh [51] [45]. However, because the preview runs quickly on the analytics data source, this flow is generally fast.
Multi-Pivot and Dashboard Embedding
A single workbook can contain multiple pivot tables (each on its own tab, or multiple pivots on one tab) [15]. This lets users create a dashboard-like view of related analytics in one place. For instance, a “Sales Analysis” workbook might have one pivot for monthly revenue by region, another pivot for quarter-over-quarter sales, a chart for product category shares, and a summary table of top customers – all within that workbook. Each pivot can use the same dataset or different linked datasets. Multiple charts can also be created from one or more pivots. In this way, a workbook functions like an Excel workbook with multiple sheets and visualizations.
Workbooks (and their pivots/charts) can be added to NetSuite dashboards via portlets. The data in these portlets can also be exported. This extends analytics to executives or employees who prefer dashboards over the full Analytics UI. Because Workbooks use the unified data model, values on a dashboard remain consistent with any reports or saved searches.
Finally, workbook views can be scheduled or emailed just like Saved Searches. While not the main focus here, SuiteAnalytics offers scheduling of workbook outputs; the provided guide notes that scheduling/email is available for both Saved Searches and Workbooks [15]. Thus, a pivot or chart can be automatically delivered to stakeholders on a regular basis.
Pivot Exports and Preservation
Users frequently need to export the results of a pivot or table (for further offline handiwork or for archival). SuiteAnalytics Workbook provides an “Export” button (in the toolbar) on both the Data and Pivot tabs [18]. Clicking it presents format options:
- CSV – exports the raw dataset results (as a simple CSV file). This yields all rows of the underlying query (respecting filters) with no grouping. It is useful for loading the data into other BI tools or spreadsheets. (Note: PDF and CSV exports do not preserve Excel-specific formatting such as currency symbols, conditional rules, or percent formats [14].)
- Excel – exports the formatted view of the table or pivot into an .xlsx workbook. Crucially, for pivots this preserves the pivot’s row/column layout and hierarchy [18]. This means each level of the pivot appears as nested rows/columns in the Excel file, much like an actual Excel pivot table. Users can then open that Excel and have the pivot structure intact, often facilitating further analysis or presentation.
- PDF – exports a static, printable snapshot of the current view (table or chart) to PDF [18]. Good for emailing or posting to boards, PDF respects visual styling but is not interactive.
These export options allow one-click data sharing. For example, after creating a multi-tab workbook of financial metrics, an analyst could export each pivot to Excel and combine them in a report. The Excel export is especially powerful — it transfers the Workbook’s organization directly into a spreadsheet format [18], so end-users don’t have to re-create complex pivots manually.
Key Takeaways on Pivots
SuiteAnalytics Workbook’s pivot functionality is equivalent to (and in some ways beyond) Excel’s pivot tables: it supports cross-tabulation, aggregation, sorting, formatting and charting in a visual way [11] [15]. It eliminates formula writing for those tasks by offering a UI for calculated measures and summaries [13]. The ability to filter pivots independently, create multiple pivots, and export them as Excel means Workbook can serve both analysts and dashboard viewers. Official NetSuite documentation emphasizes that Workbook pivots can use fields from the dataset and add multiple dimensions [52] [45]. In practice, skilled users can build sophisticated multi-dimensional reports – for instance, pivoting Amount by Customer Category, Month, and Sales Rep – and share them broadly.
However, one must respect some constraints (Table 1 compares key points with Saved Searches). Every field you want in a pivot must be included in the dataset [52]. Large pivots can still suffer performance issues if the dataset is huge. But overall, Workbook pivots provide a far easier path to interactive data analysis than any previous native tool. As one partner notes, being able to drag fields to rows/columns and immediately see a cross-tabulated summary is akin to giving a non-technical user a powerful analytics sandbox [2] [23].
Exporting Data and Excel Integration
SuiteAnalytics Workbook does not stand in isolation; its data often needs to move to other systems or formats. We have touched on the one-click export of tables and pivots (CSV, Excel, PDF). Here we elaborate on those and other integration options.
Export Options in Detail
As noted, the Export icon in the Workbook toolbar provides three main output formats [18]:
-
CSV (Comma-Separated Values): Selecting CSV will export the raw data behind the active view. If on the Data tab, it exports all returned rows and columns. If on the Pivot tab, it likewise outputs all underlying data (not the summarized table) – effectively the same as viewing “Show Details” on each pivot cell. CSV is ideal for loading into ETL pipelines or BI tools. Users can also schedule a CSV extract via Automation (SuiteAnalytics Connect, or scripts). Caveat: CSV does not preserve any workbook formatting. NetSuite notes that CSV exports will strip currency symbols, percent signs, and conditional formatting [14].
-
Excel (.xlsx): This export is more sophisticated. If exporting from the Table (Data) tab, the result is a formatted worksheet of the table. If exporting from a Pivot tab, the generated Excel includes the pivot table layout. In practice, the pivot export creates an .xlsx file where each pivot becomes one or more Excel sheets, maintaining the row/column hierarchy, and with data cells filled in. (This is much more user-friendly than a simple CSV for pivot output.) For example, if a pivot had products by year with revenue, the Excel sheet will have a table with products as rows, years as columns, and revenue figures. This lets users open it directly in Excel and see the pivot as it was in NetSuite. The export also includes any text or labels as plain cells. Because of this, the Excel export is preferred for reports or presentations that require the formatted layout [18].
-
PDF: Exporting to PDF produces a static document capturing the visible view. It includes styling (colors, fonts) and is scaled for print. For pivot tables, each page includes the table for the current pivot scroll position. Charts export well to PDF as high-resolution graphics. PDF is typically used for formal reports or emailing to stakeholders who don’t use NetSuite [18]. It’s not editable, but it’s convenient for sharing.
Additionally, for dataset structure, there is an export option hidden in the Datasets list. With AnalyticsAdmin permission, one can open any saved dataset and click Export > Export dataset to SuiteQL TXT. This downloads a text file containing the SuiteQL (SQL) query definition [9]. Having this SQL is valuable for developers: it shows exactly which joins and filters compose the dataset. For example, Tim Dietrich demonstrated that the exported SuiteQL for a “Transaction Detail” dataset reveals all joined tables and even currency conversion logic (Source: timdietrich.me). While not an end-user feature, this confirms that Workbook datasets are fully queryable at the SQL level if needed.
Putting It All Together (Excel and Analysis)
The combination of native pivot/chart capabilities and robust export makes Workbook a comprehensive analytics environment. A typical workflow might be: define dataset → build pivots/charts in Workbook → export any needed views to Excel for finishing touches or to share outside NetSuite. This avoids the old pattern of performing all analysis in external tools. For example, before Workbook, an analyst might run a Saved Search on orders, export to Excel, build pivot charts, and then re-import or upload to NetSuite as a static report. Now, all those steps can be done in one place, with direct export only as a final step for non-system consumption [19] [18].
Because the Excel export preserves pivot structure, finance teams can rely on NetSuite to deliver quarterly reports in a spreadsheet-ready format. Similarly, marketing teams can drag fields, create charts in Workbooks, and then export those charts to embed in slide decks. The key is that Workbook supplants the need to manually move data: it supports collaboration (datasets and workbooks can be shared by role [53]) and automated delivery (through portlets and scheduling), while still offering the familiar Excel interface when desired.
Finally, for complex analysis beyond what Workbooks can handle alone, NetSuite provides SuiteAnalytics Connect – a separate feature that exposes the analytics data source via ODBC/SuiteQL. Advanced users can use Connect to pull the same underlying data (in real time) into external BI or data warehouse tools for in-depth modeling. In fact, one recommended approach is to build the dataset in Workbook, export the SuiteQL to understand the query, and then use Connect or ETL tools to replicate or extend the analysis. This synergy ensures that Workbook can act as both a quick analytics workspace and a gateway to further data exploration if needed.
Comparison to Other Tools
SuiteAnalytics Workbook coexists with other NetSuite reporting options. The most direct comparison is to Saved Searches, since both run inside NetSuite and can be scheduled or shared. We summarize key contrasts in Table 1 below.
| Capability | Saved Search | SuiteAnalytics Workbook |
|---|---|---|
| Data Queries | Simple queries on one record type; limited multi-record joins (often requiring manual linking across searches) [15]. Drag-and-drop for filters and formulas, immediate results. | Advanced queries via Datasets. Multi-level joins across modules built visually [27] [54]. Live preview of results while building—no need to save and rerun. |
| Data Exploration | Best for structured, tabular queries with filters. Outputs text-based lists or summary (single-level grouping). | Designed for discovering patterns and trends [20]. Users can pivot and slice data dynamically within the same report. |
| Reporting Style | Produces lists or static summaries (group by a few fields). Limited to one visualization (list or summary grid). | Produces highly visual dashboards: multiple pivot tables, multi-tab analysis, and charts in one workbook [15] [20]. Enables combining different views on one screen. |
| Real-Time Updates | Query runs on demand or scheduled; no internal caching. Generally fast for small queries, but large saved searches can delay or timeout. | Built for real-time dashboards. Workbook queries the live data source on refresh; data can also be cached up to 60 minutes for performance [29]. Refreshing is user-controlled. |
| Calculation | Supports formula (SQL) columns in the Saved Search UI [15]. Complex SQL must be hand-coded. | Supports drag-and-drop calculated measures and formula fields within datasets [13] [42]. No SQL knowledge needed for many calculations. |
| Visualizations | Graphing is limited (“Summary” charts only) and separate from report list. Conditional formatting only highlights rows. | Full chart engine integrated (bar, line, pie, etc.) [15]. Conditional formatting down to individual cells, gradients, thresholds. Multiple charts and pivots per report. |
| Ease of Use | Familiar interface; quick to create simple searches. Steep learning curve for joins or advanced formulas. | Requires understanding dataset logic and drag-drop interface. Intuitive once learned, especially for creating pivot-style analysis [37] [55]. Suitable for both analysts and power users. |
| Distribution | Findings can be emailed, turned into KPIs, or di | The focus on Cube. The integration allows those who cannot on generation. |
| Sorry. I hit a glitch. Let me rewrite the table properly. |
External Sources
About Houseblend
HouseBlend.io is a specialist NetSuite™ consultancy built for organizations that want ERP and integration projects to accelerate growth—not slow it down. Founded in Montréal in 2019, the firm has become a trusted partner for venture-backed scale-ups and global mid-market enterprises that rely on mission-critical data flows across commerce, finance and operations. HouseBlend’s mandate is simple: blend proven business process design with deep technical execution so that clients unlock the full potential of NetSuite while maintaining the agility that first made them successful.
Much of that momentum comes from founder and Managing Partner Nicolas Bean, a former Olympic-level athlete and 15-year NetSuite veteran. Bean holds a bachelor’s degree in Industrial Engineering from École Polytechnique de Montréal and is triple-certified as a NetSuite ERP Consultant, Administrator and SuiteAnalytics User. His résumé includes four end-to-end corporate turnarounds—two of them M&A exits—giving him a rare ability to translate boardroom strategy into line-of-business realities. Clients frequently cite his direct, “coach-style” leadership for keeping programs on time, on budget and firmly aligned to ROI.
End-to-end NetSuite delivery. HouseBlend’s core practice covers the full ERP life-cycle: readiness assessments, Solution Design Documents, agile implementation sprints, remediation of legacy customisations, data migration, user training and post-go-live hyper-care. Integration work is conducted by in-house developers certified on SuiteScript, SuiteTalk and RESTlets, ensuring that Shopify, Amazon, Salesforce, HubSpot and more than 100 other SaaS endpoints exchange data with NetSuite in real time. The goal is a single source of truth that collapses manual reconciliation and unlocks enterprise-wide analytics.
Managed Application Services (MAS). Once live, clients can outsource day-to-day NetSuite and Celigo® administration to HouseBlend’s MAS pod. The service delivers proactive monitoring, release-cycle regression testing, dashboard and report tuning, and 24 × 5 functional support—at a predictable monthly rate. By combining fractional architects with on-demand developers, MAS gives CFOs a scalable alternative to hiring an internal team, while guaranteeing that new NetSuite features (e.g., OAuth 2.0, AI-driven insights) are adopted securely and on schedule.
Vertical focus on digital-first brands. Although HouseBlend is platform-agnostic, the firm has carved out a reputation among e-commerce operators who run omnichannel storefronts on Shopify, BigCommerce or Amazon FBA. For these clients, the team frequently layers Celigo’s iPaaS connectors onto NetSuite to automate fulfilment, 3PL inventory sync and revenue recognition—removing the swivel-chair work that throttles scale. An in-house R&D group also publishes “blend recipes” via the company blog, sharing optimisation playbooks and KPIs that cut time-to-value for repeatable use-cases.
Methodology and culture. Projects follow a “many touch-points, zero surprises” cadence: weekly executive stand-ups, sprint demos every ten business days, and a living RAID log that keeps risk, assumptions, issues and dependencies transparent to all stakeholders. Internally, consultants pursue ongoing certification tracks and pair with senior architects in a deliberate mentorship model that sustains institutional knowledge. The result is a delivery organisation that can flex from tactical quick-wins to multi-year transformation roadmaps without compromising quality.
Why it matters. In a market where ERP initiatives have historically been synonymous with cost overruns, HouseBlend is reframing NetSuite as a growth asset. Whether preparing a VC-backed retailer for its next funding round or rationalising processes after acquisition, the firm delivers the technical depth, operational discipline and business empathy required to make complex integrations invisible—and powerful—for the people who depend on them every day.
DISCLAIMER
This document is provided for informational purposes only. No representations or warranties are made regarding the accuracy, completeness, or reliability of its contents. Any use of this information is at your own risk. Houseblend shall not be liable for any damages arising from the use of this document. This content may include material generated with assistance from artificial intelligence tools, which may contain errors or inaccuracies. Readers should verify critical information independently. All product names, trademarks, and registered trademarks mentioned are property of their respective owners and are used for identification purposes only. Use of these names does not imply endorsement. This document does not constitute professional or legal advice. For specific guidance related to your needs, please consult qualified professionals.